Once you establish the Shopify store, you probably more often write a blog article to promote Owned Media.
Even writing a blog with all your effort will waste your time if nobody reads it. Recently, Google has come to evaluate with user activity log whether articles are adequately read and improving SEO (Search Engine Optimization.)
This article will explain how to use Google Analytics and Google Tag Manager to measure how well visitors read your blog.
Contents
- 1 Creating a Google Tag Manager account
- 2 Set Google Tag Manager tags to Shopify
- 3 “What percentage of a blog do visitors read” and “What content do visitors like better”
- 4 What percentage of a blog do visitors read
- 5 What blog content do visitors like better
- 6 Summary
- 7 GrowthHack consulting services specialize in Shopify
Creating a Google Tag Manager account
In Google Tag Manager, you can measure consumer behavior and analyze the data on Google Analytics.
You can also use Google Tag Manager to measure whether your blog posts are correctly read.
First, let’s create a Google Tag Manager account.

Reference
The next step is setting Google Tag Manager to Shopify.
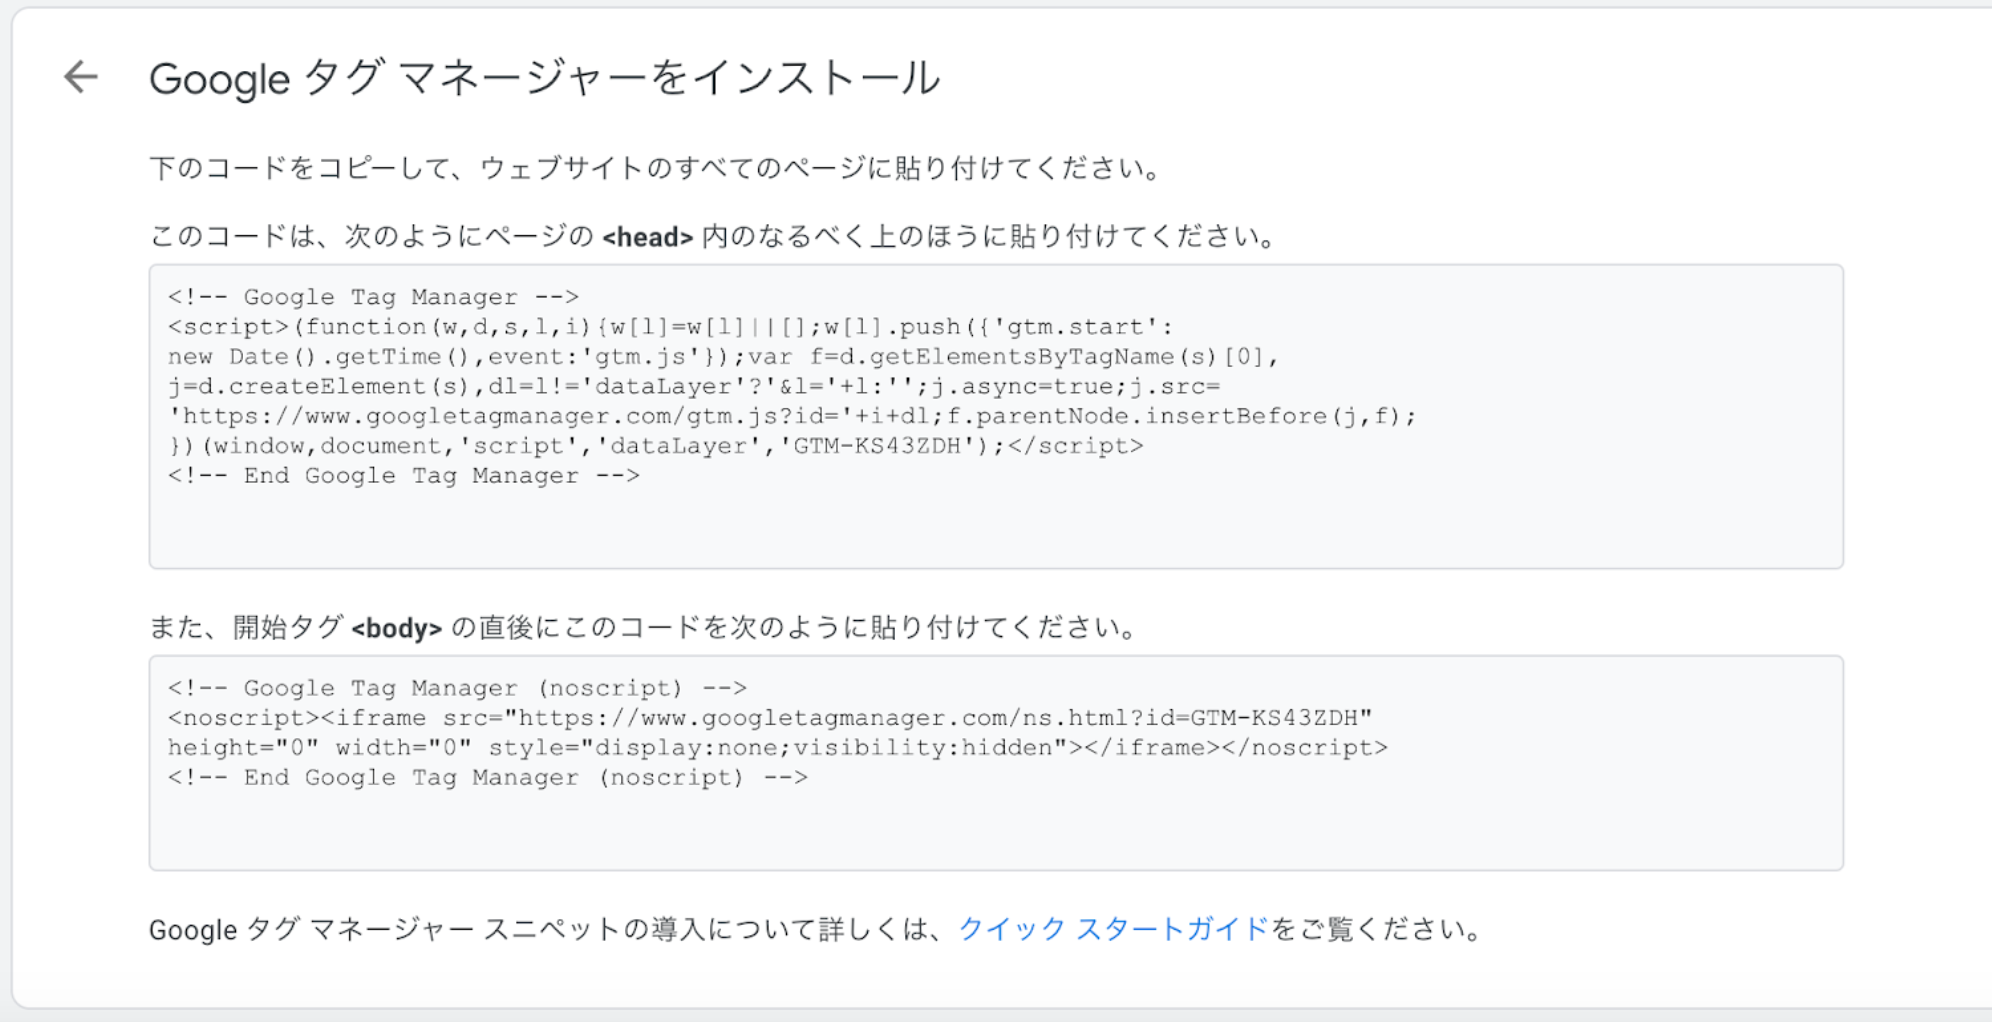
Place Google Tag Manager tags in the <head> tag and <body> tag.
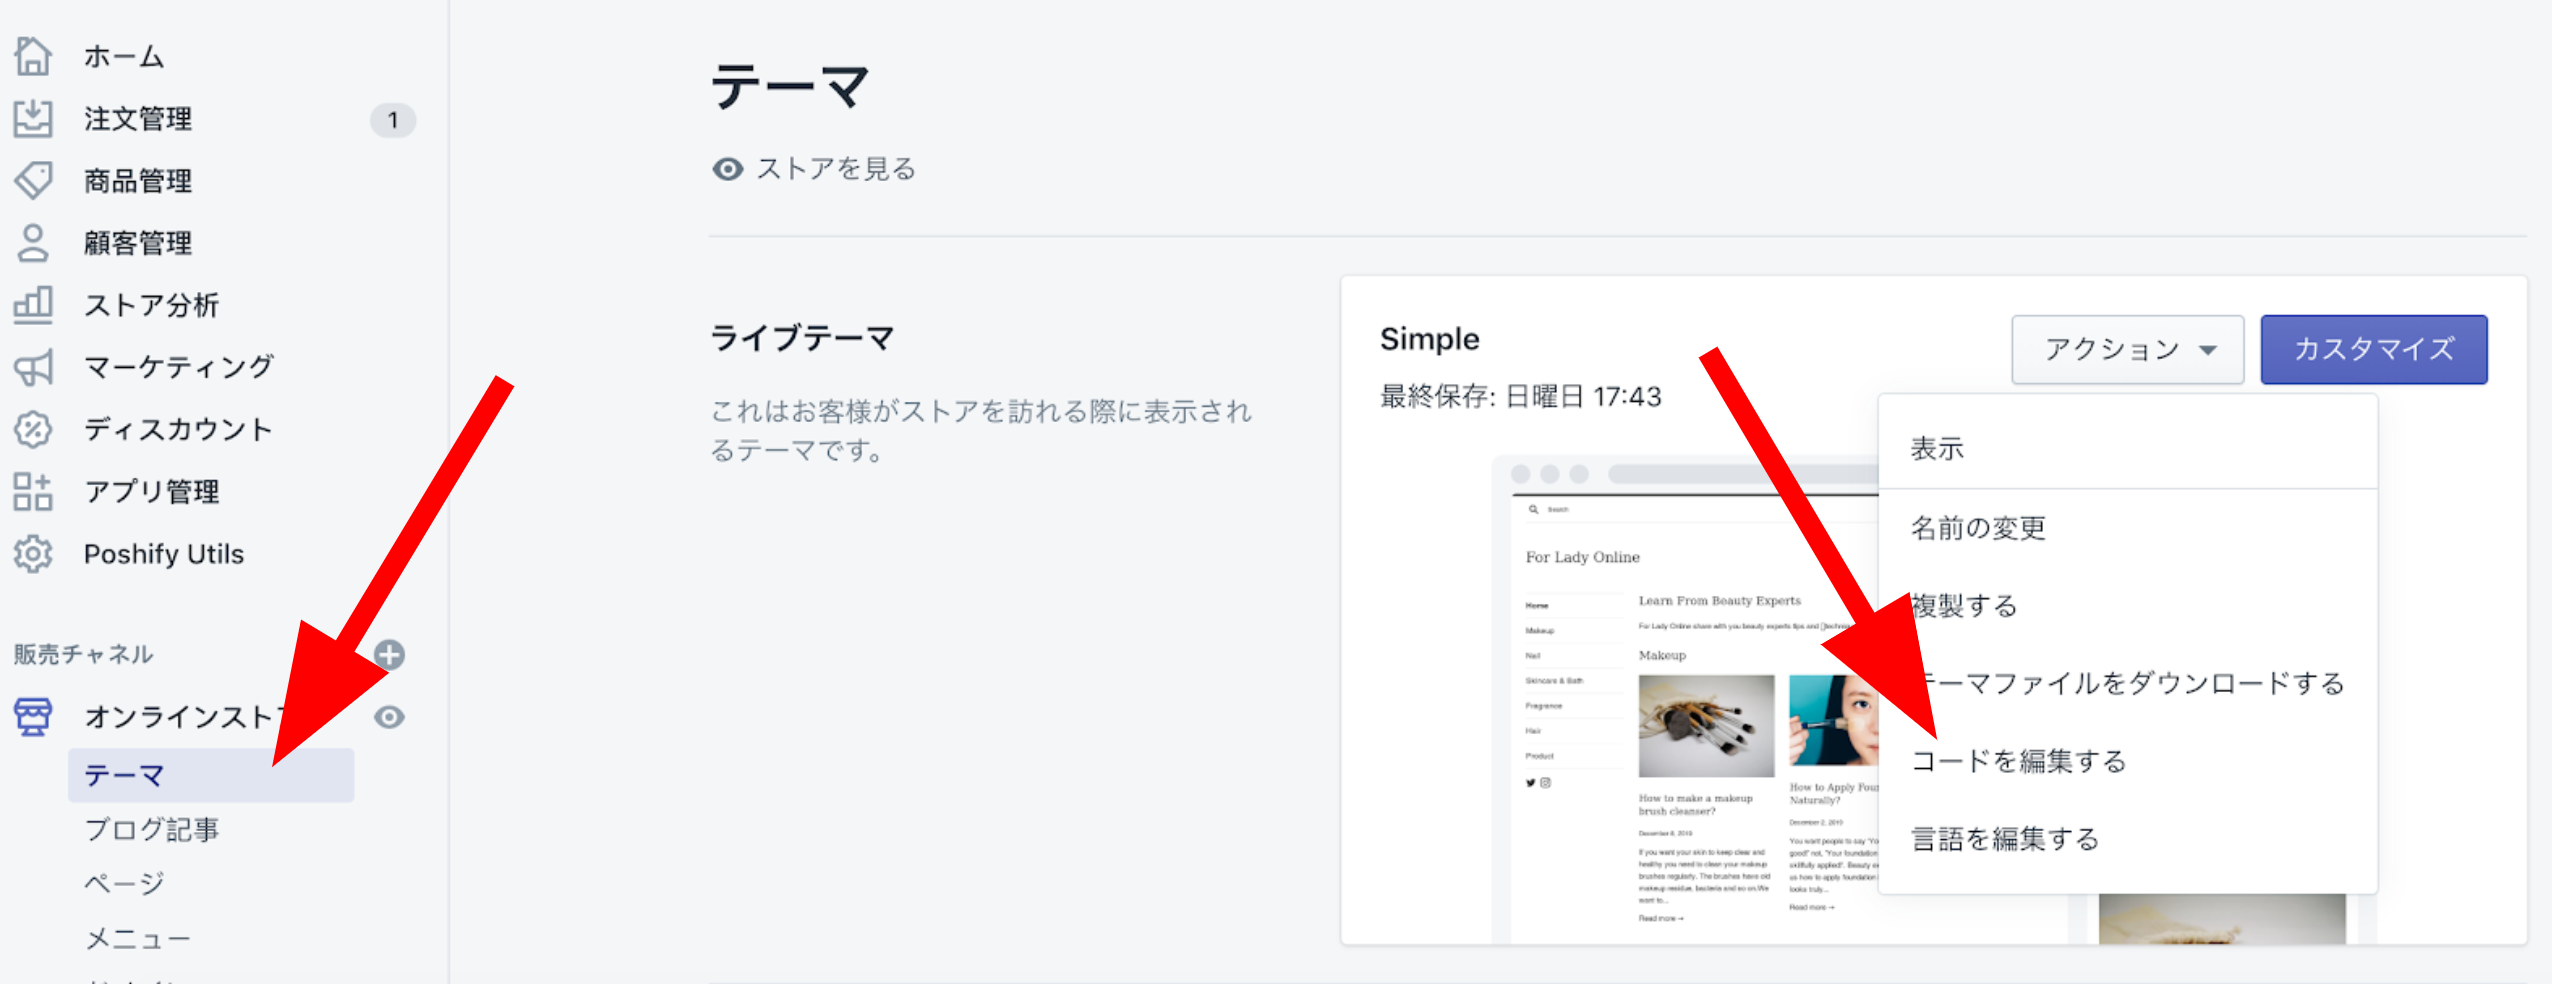
There are several ways to set tags in Shopify, but I’ll show you how to put them directly in the Theme code.
Select “Online Store”> “Theme Actions”> “Edit Code.”
There is a <head> tag and a <body> tag in the “theme.liquid” file in the Layout folder. Put the tags of Google Tag Manager in each tag.
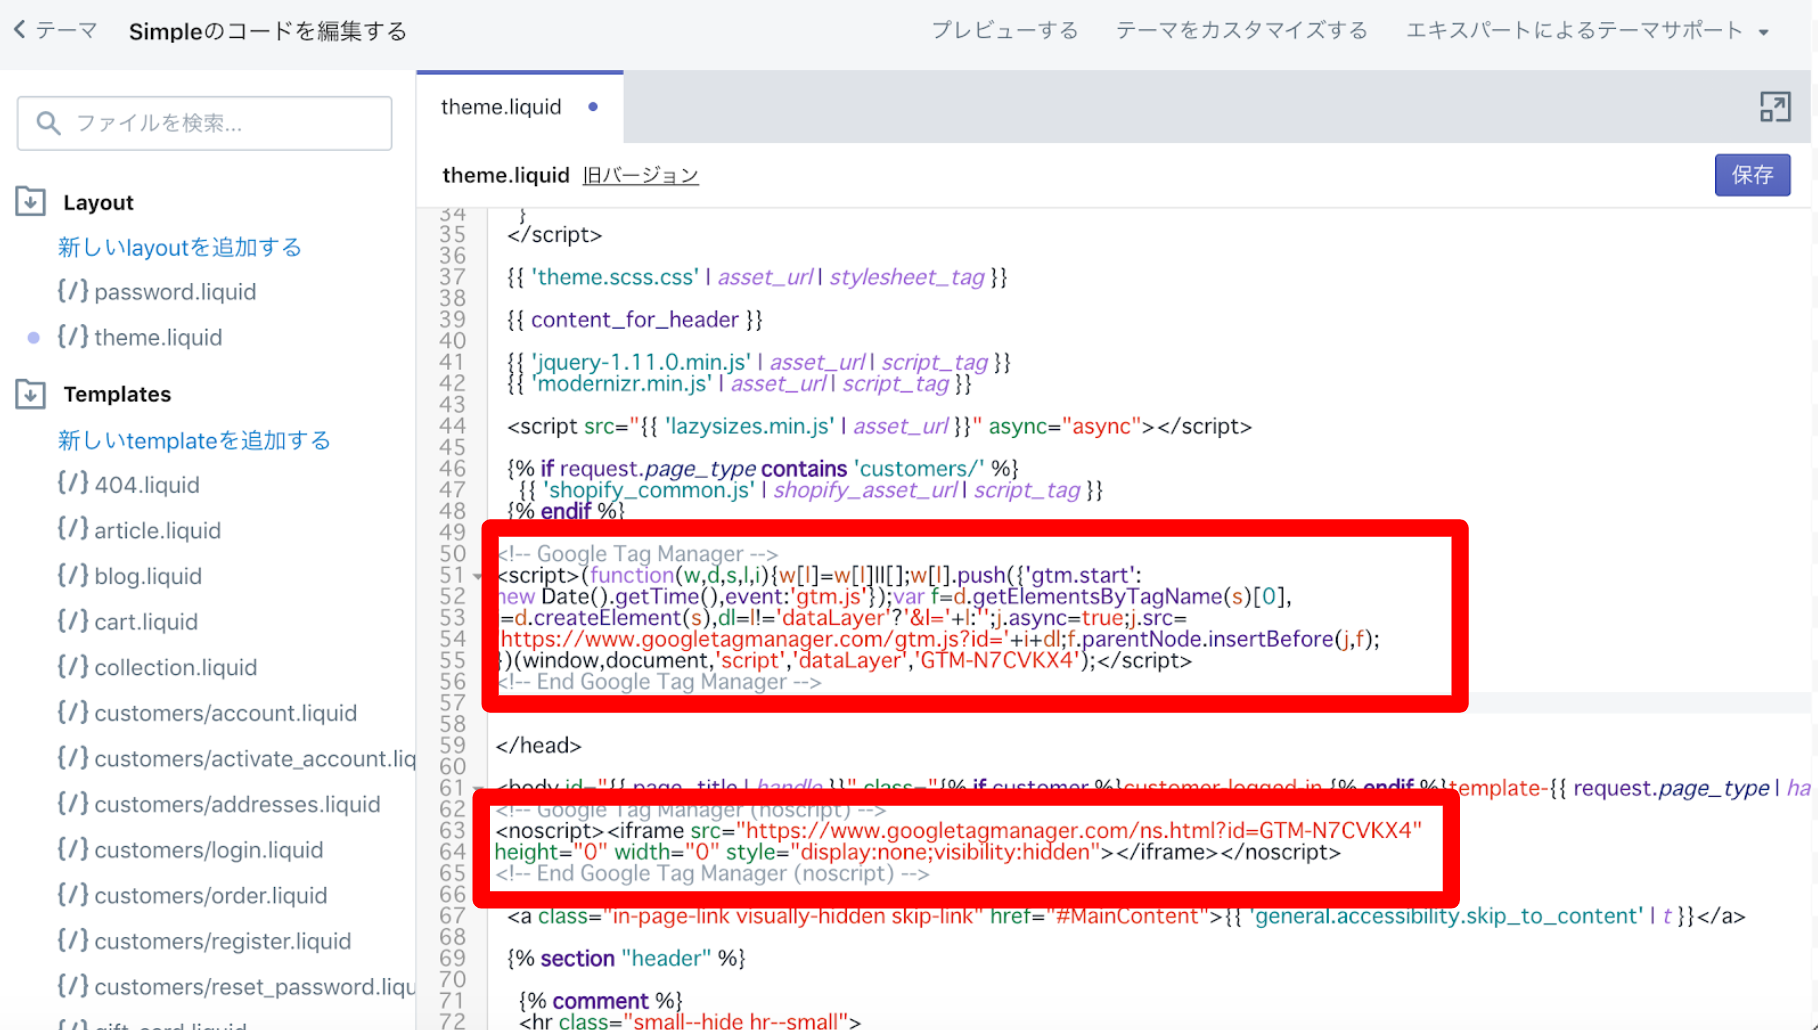
As shown in the figure, I placed the tag just before the </head>. But it is recommended to place the tag as high in the <head>.
That’s all for the tags. After that, set the action you want to get with Google Tag Manager.
“What percentage of a blog do visitors read” and “What content do visitors like better”
Let’s set up two ways to measure “how much a blog article was read” by the following;
- What percentage of a blog do visitors read
- Which content of a blog do visitors enjoy
What percentage of a blog do visitors read
Measuring what percentage of a blog visitors read, you can quantitatively assess which content customers enjoyed.
I will explain how to use Google Tag Manager and Google Analytics for measuring the percentage of each blog article read.
Set up “Scroll Depth Threshold” variable
First, select “Settings” from the “Variables” menu in the Google Tag Manager workspace.
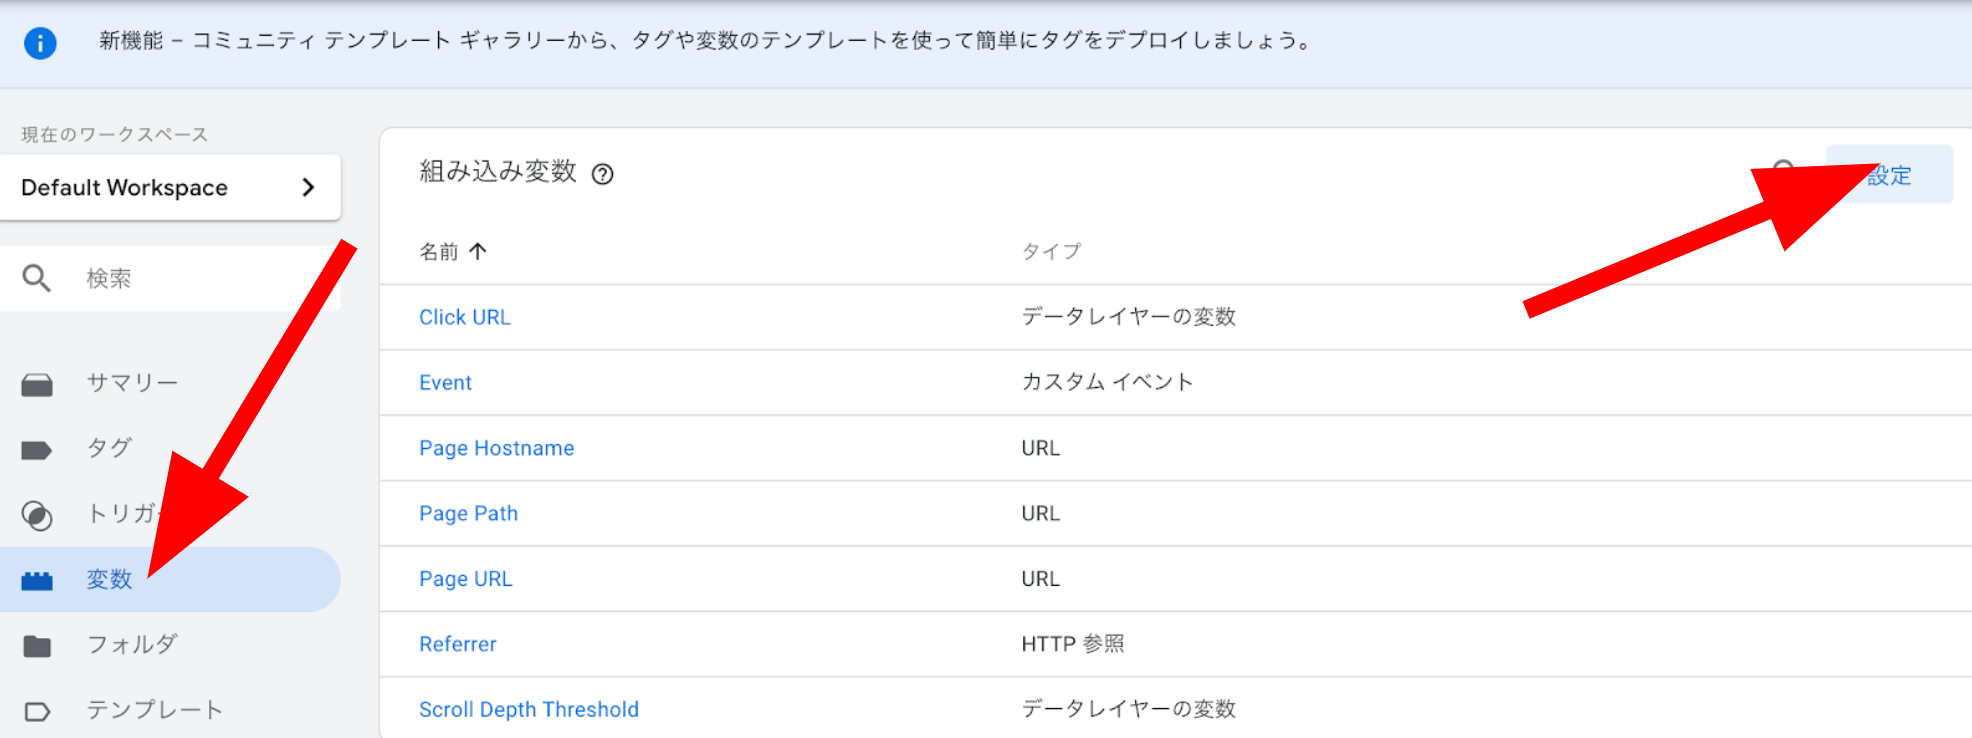
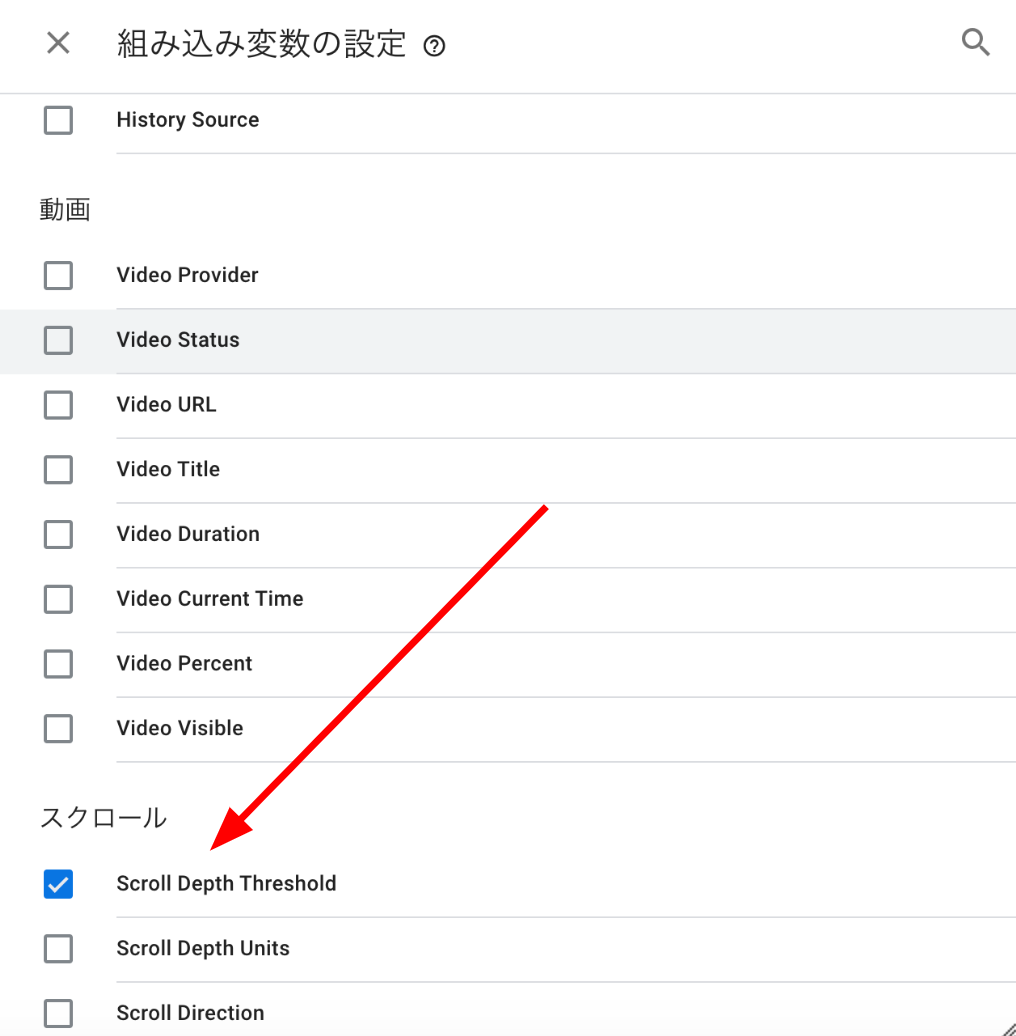
Select “Scroll Depth Threshold” in the built-in variable settings. The value of what percentage of a blog article readers viewed is taken into the variable. Let’s use it later in the setting.
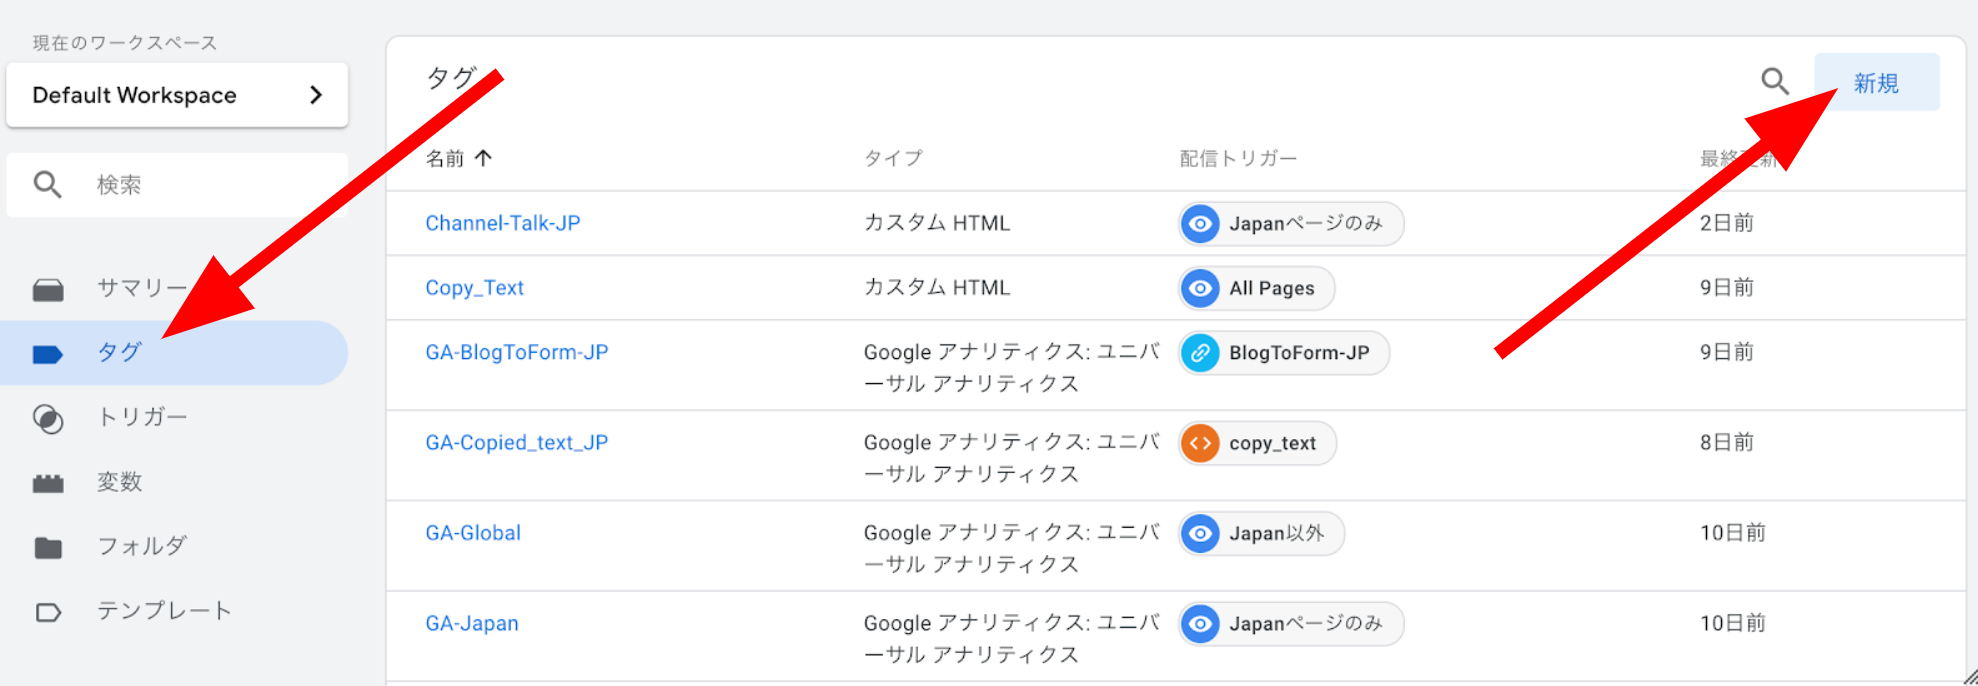
Set up Tags
Next, select “New” on the “Tags” in the Google Tag Manager workspace.
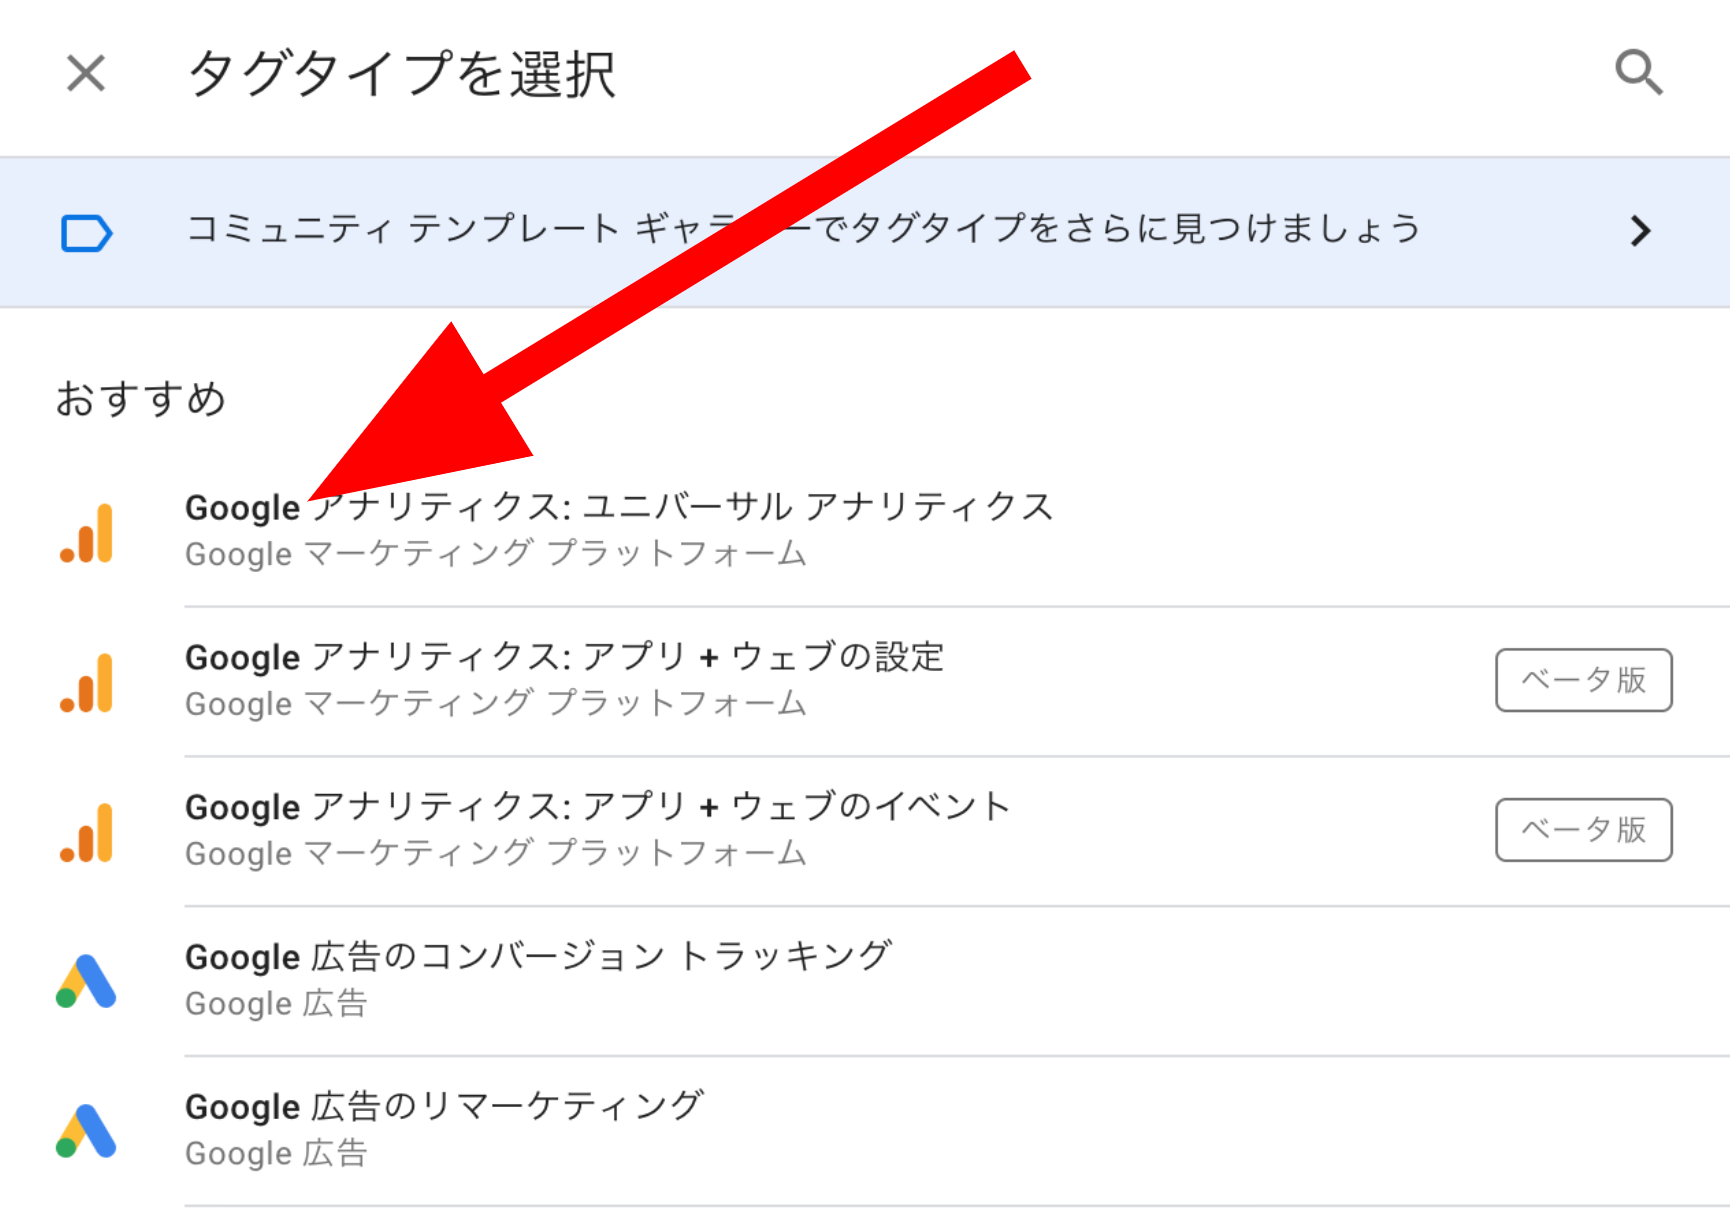
Select the tag type of “Google Analytics: Universal Analytics” by clicking on “Tag Configuration”.
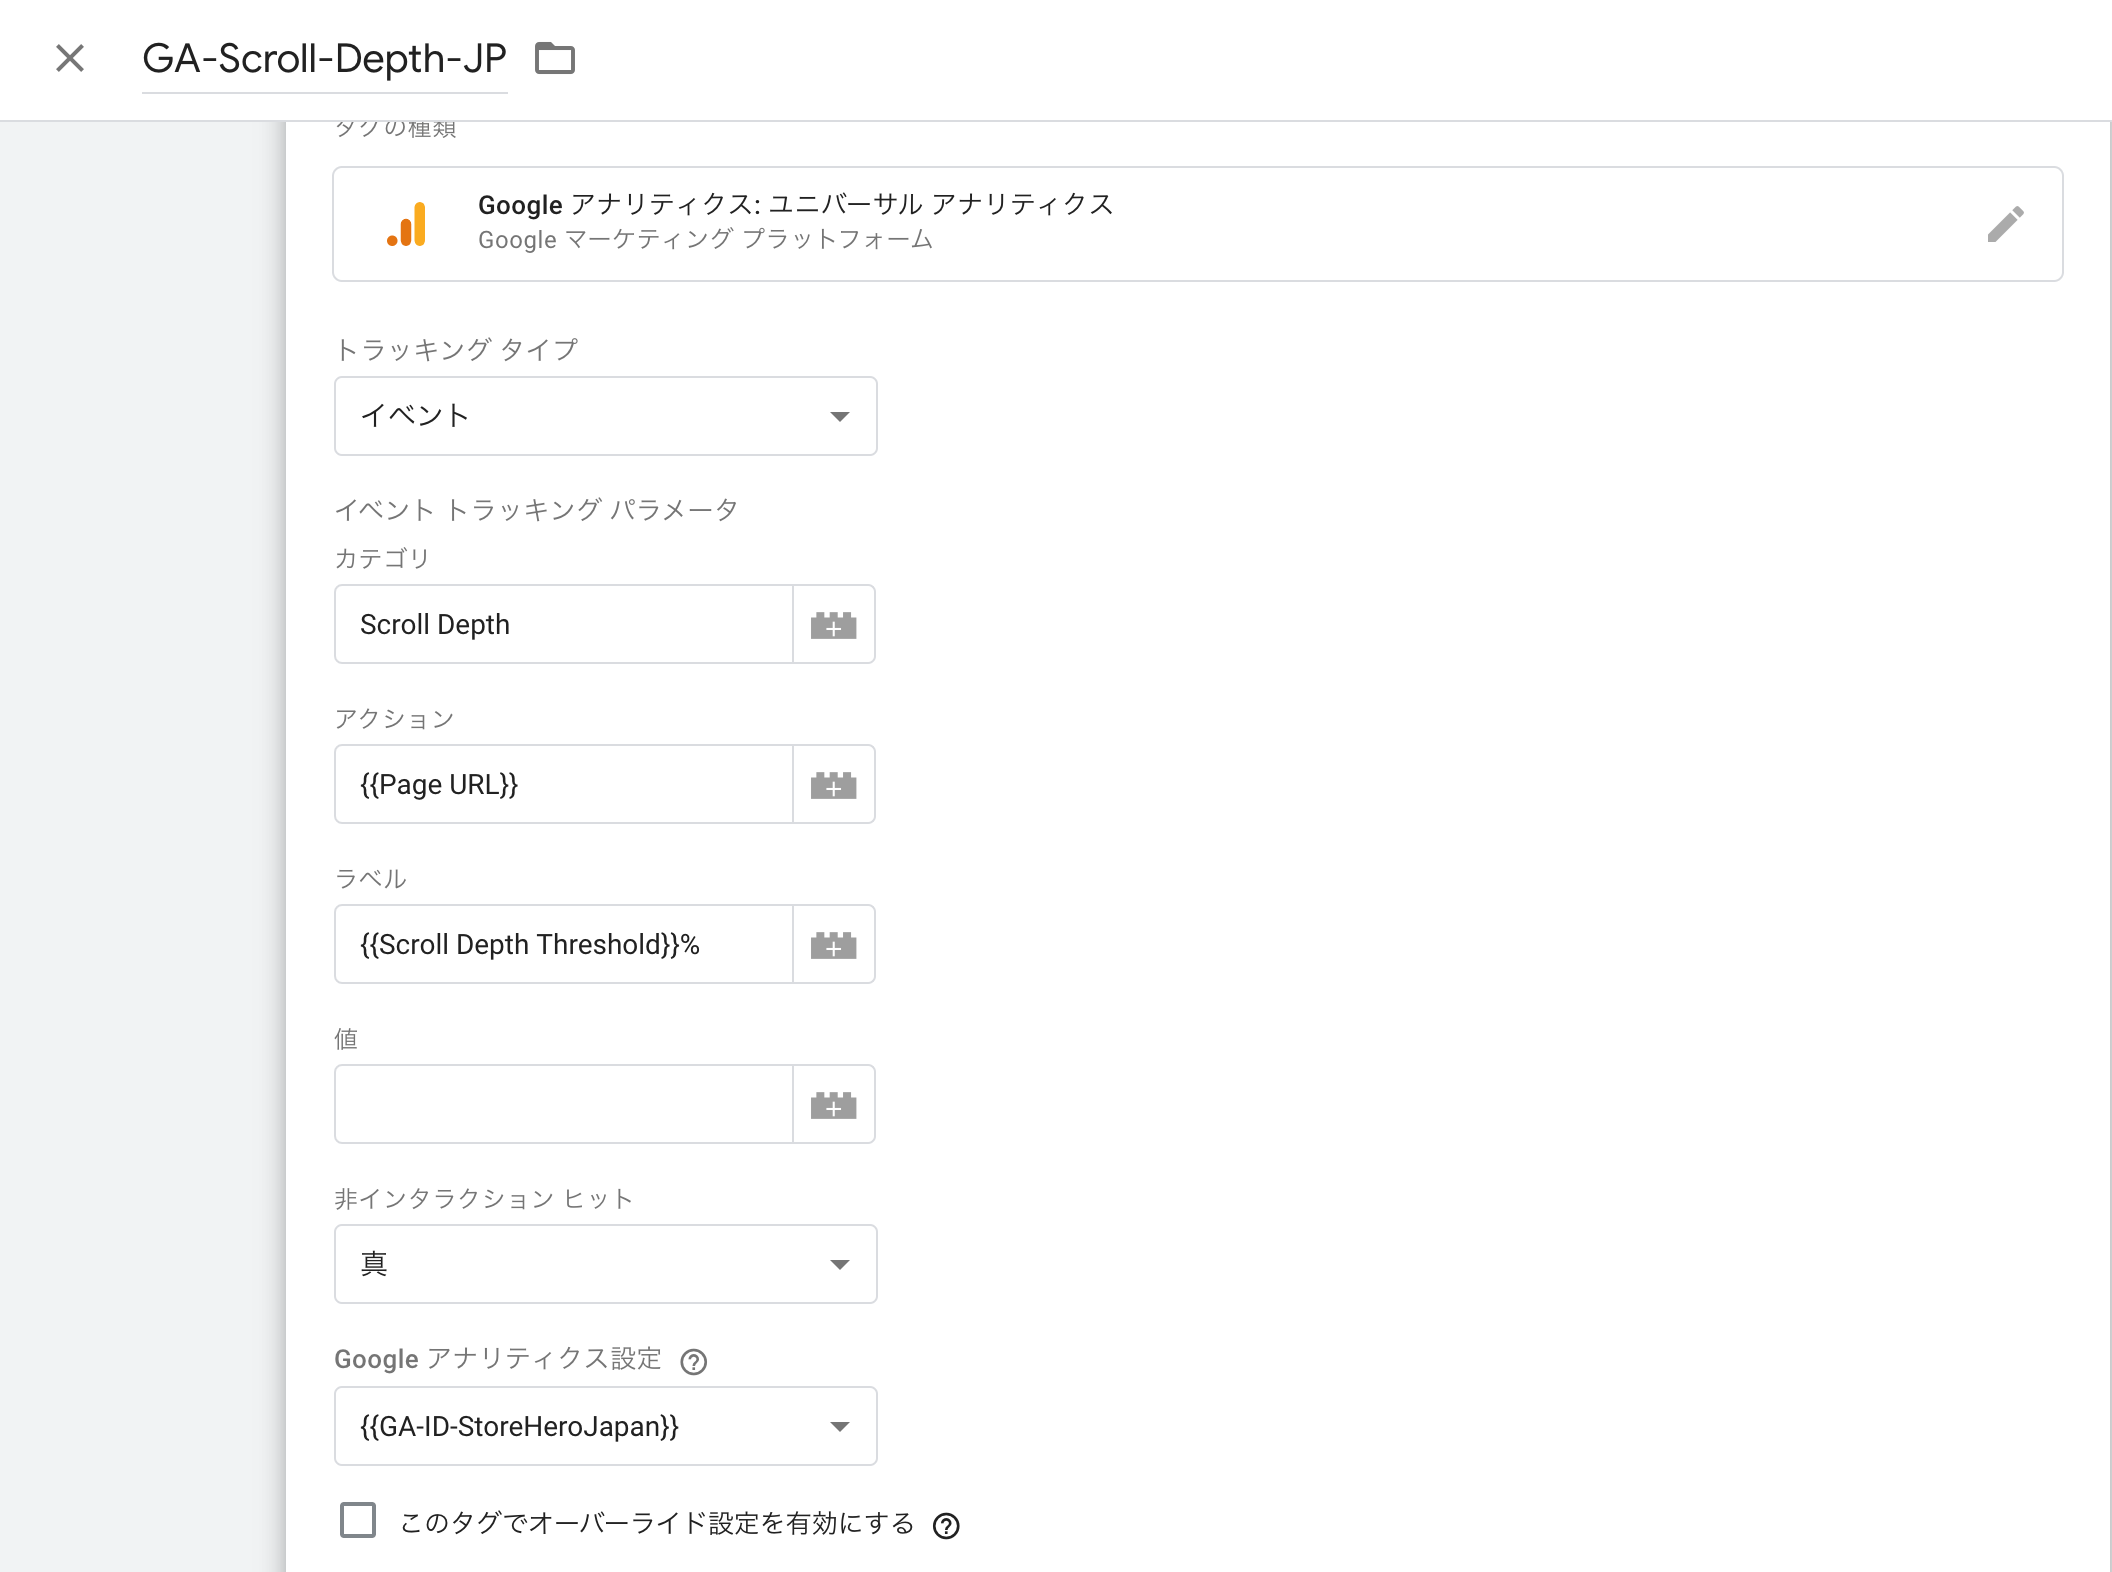
Set tags so that you can summarize what percentage was read on which page. This time, I put the tag as follows.
Tracking Type: Event
Category: Scroll Depth (Please name it how you like)
Action: {{Page URL}}
Label: {{Scroll Depth Threshold}}%
Non-Interaction Hit: True
Google Analytics Settings: Target Google Analytics Account Select
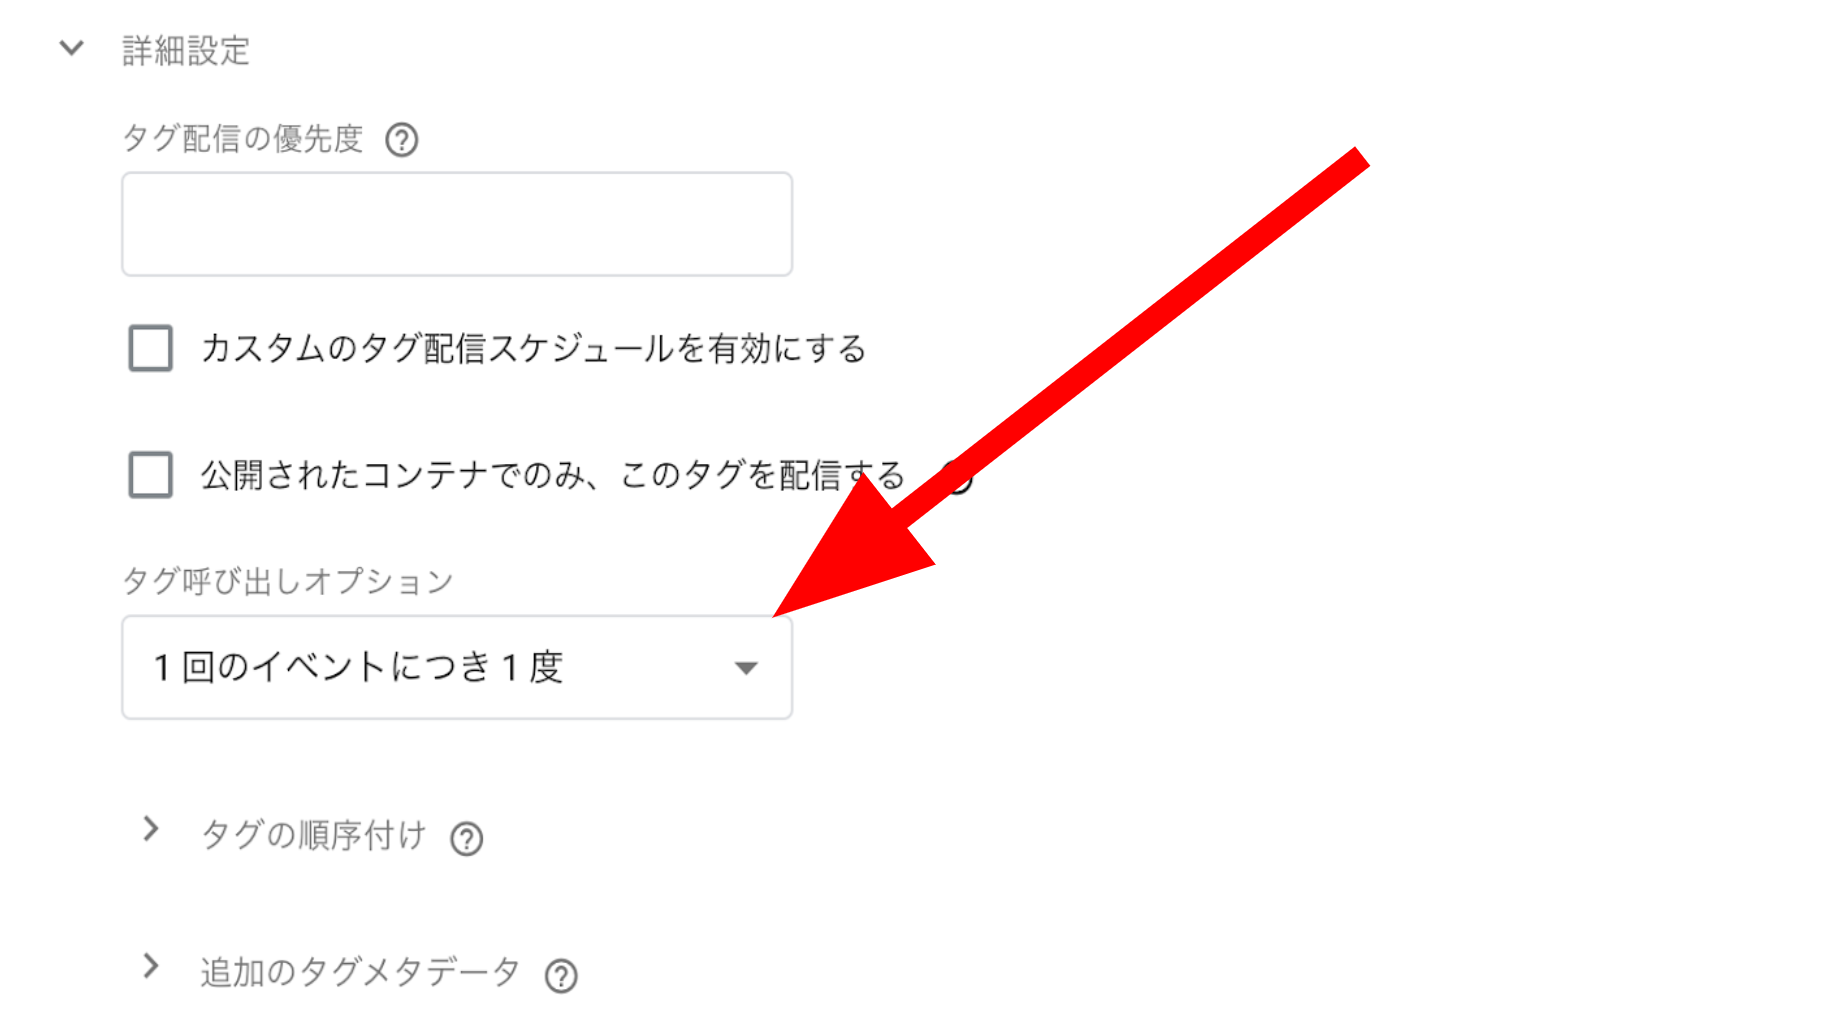
In the “Advanced Setting,” choose “Once per event” from “Tag firing options.”
Set up Triggers
Next is the trigger setting. A trigger means when to apply the measurement depends on what activity customers perform at the Shopify store.
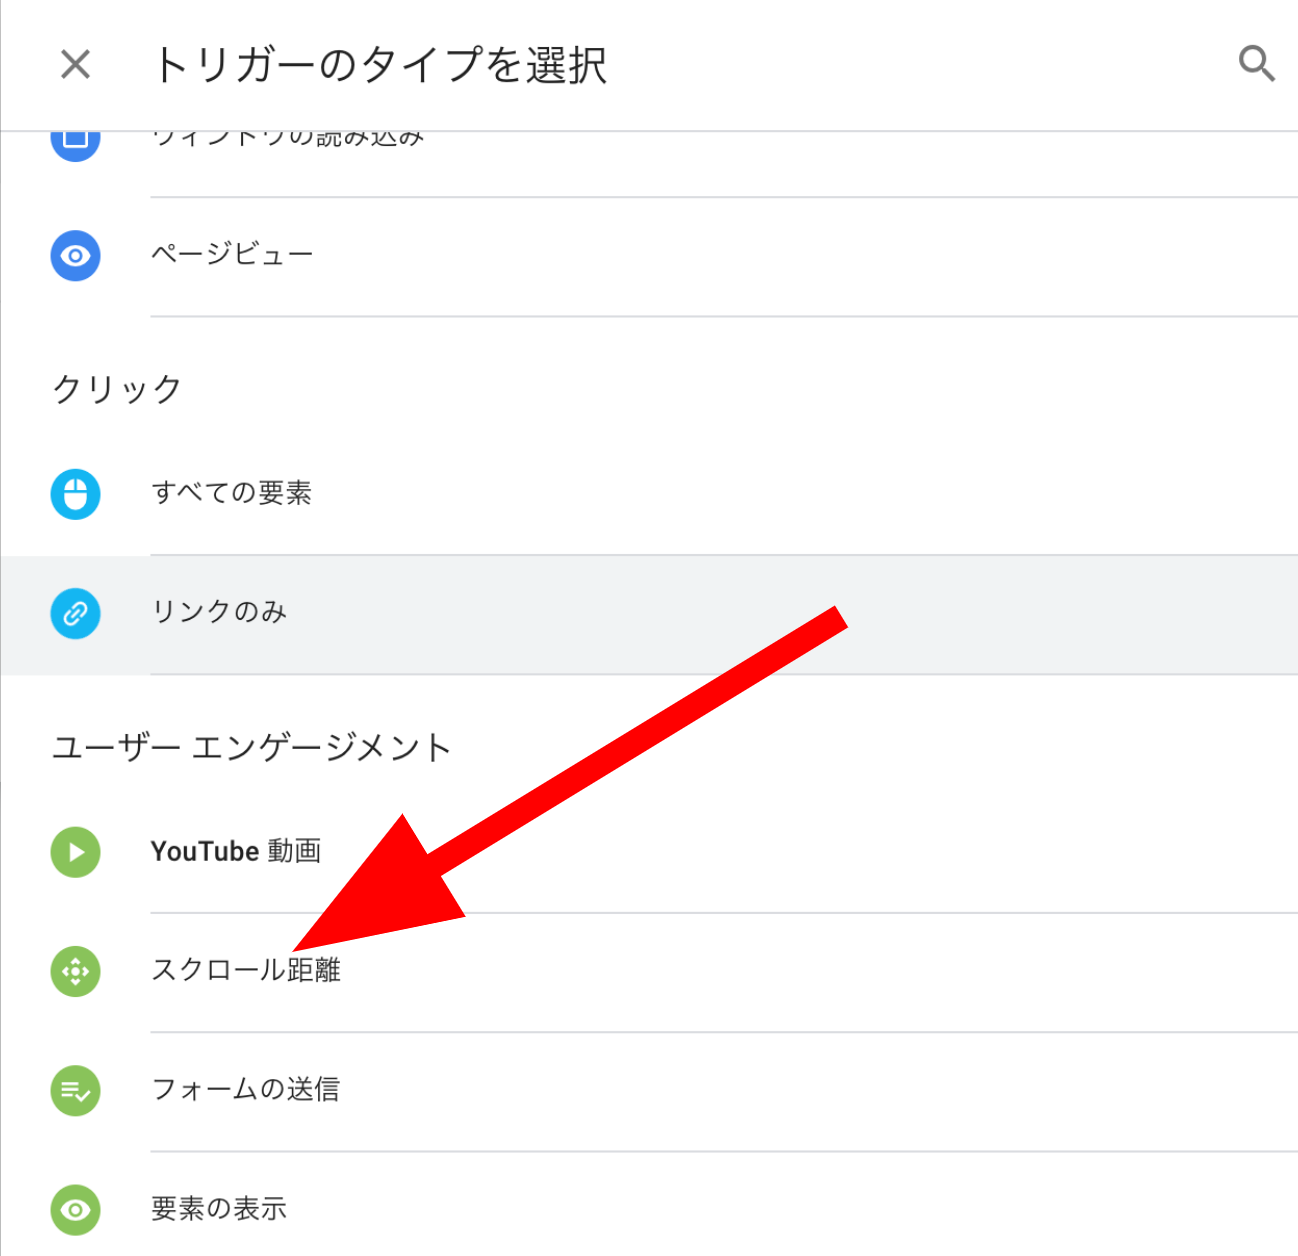
This time, select the “Scroll Depth” from the “Choose trigger types.”
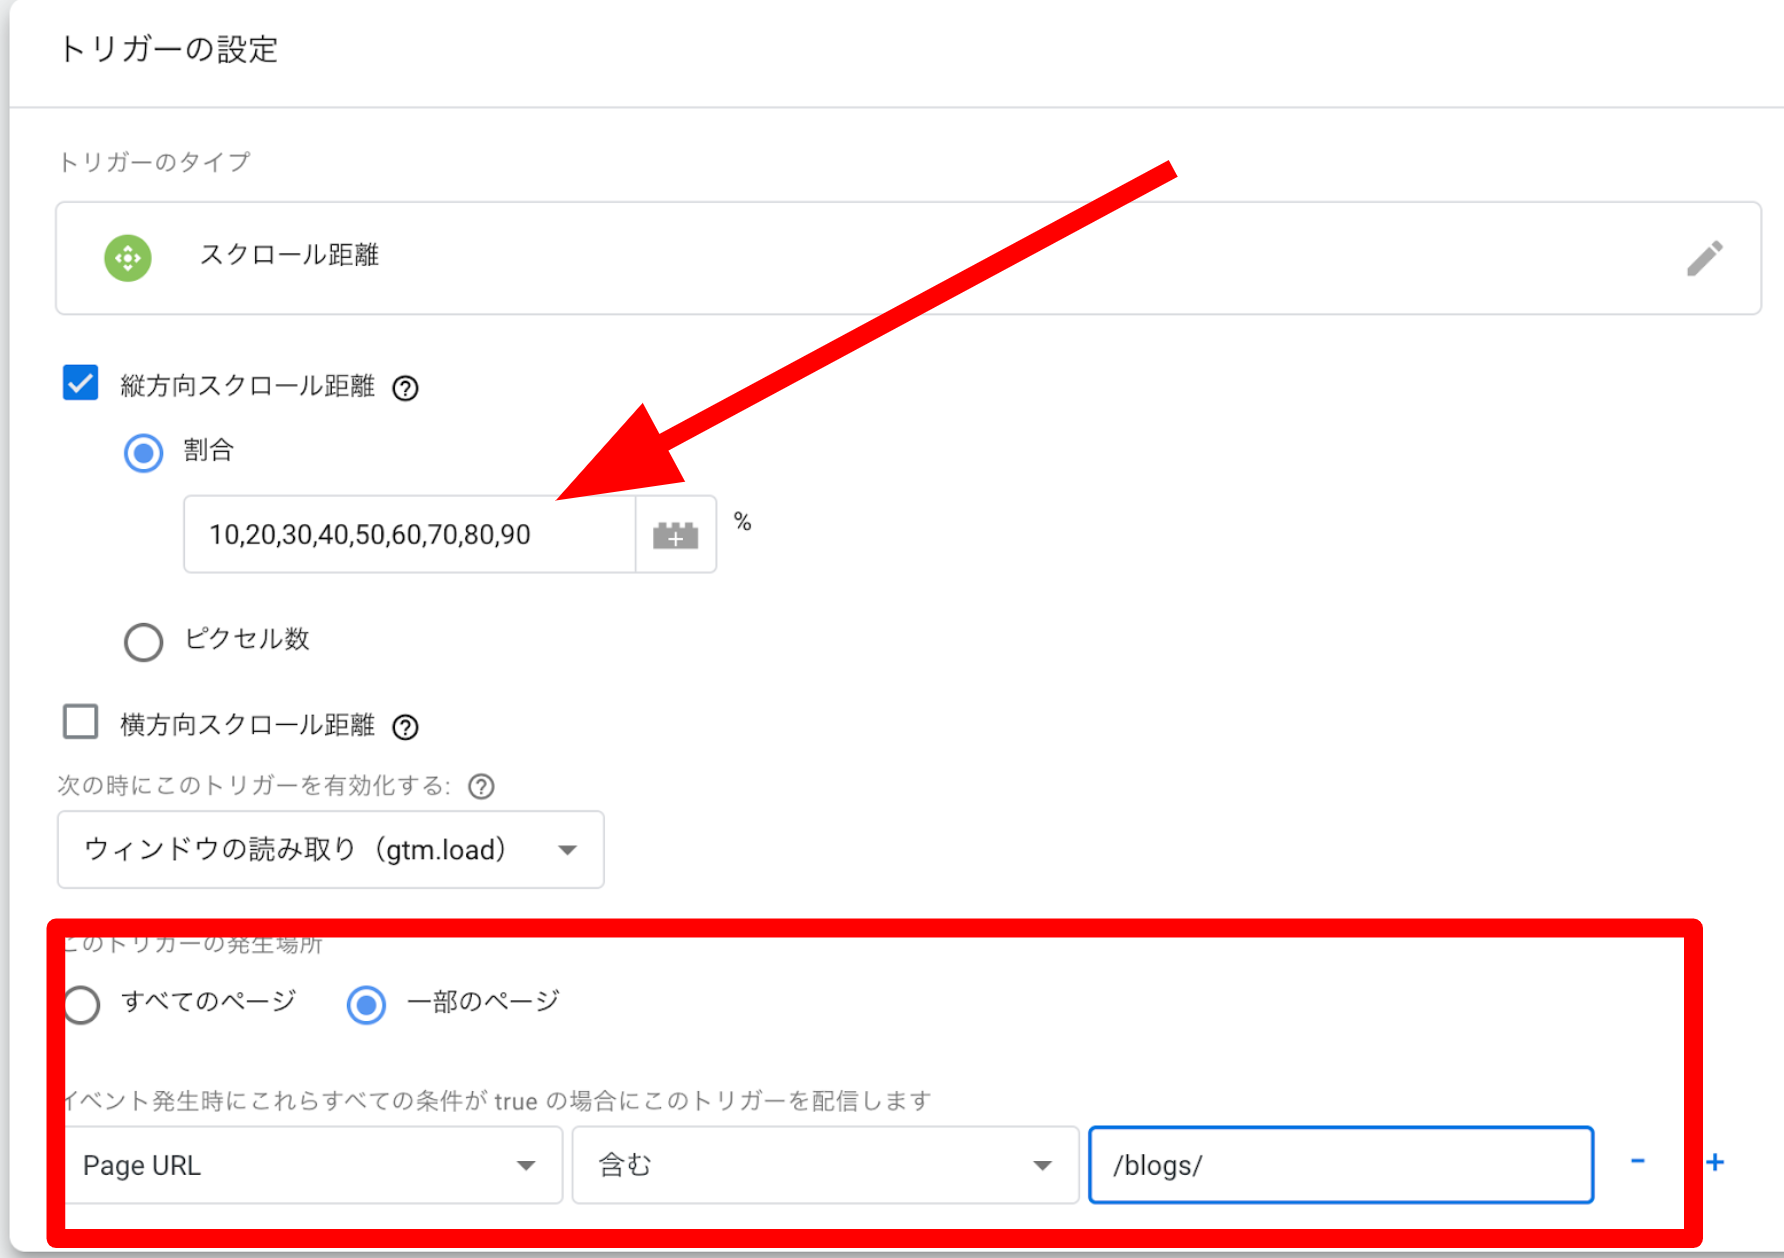
In the “Trigger settings,” check the “Vertical Scroll Depth”> “Percentages.” Enter the numeric value indicating the scroll depth. As an example, let’s put in each 10%.
If you want to measure only under blog pages, you can narrow down where to fire the trigger by selecting “Some page” when “/blogs/” is included in Page URL.
The settings were completed. Let’s Save and publish it.
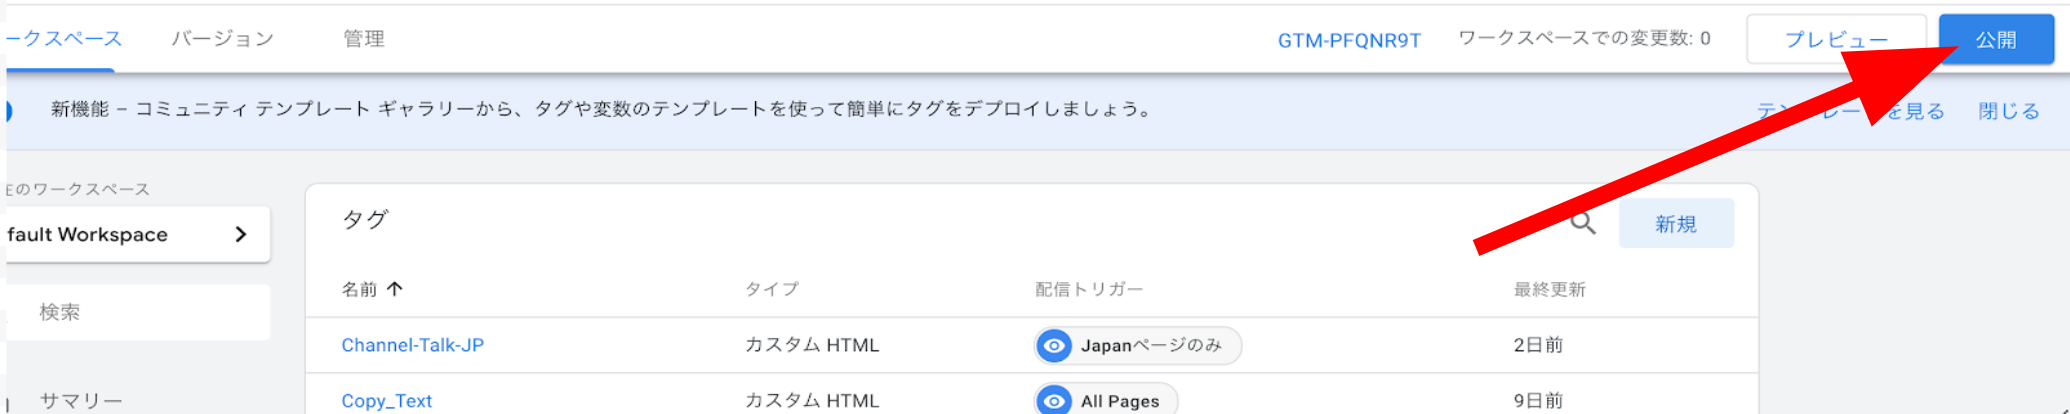
I will omit this time, but please verify with a preview whether it works properly before actually publishing it.
Analyze with Google Analytics
Let’s see if you can get data with Google Analytics.
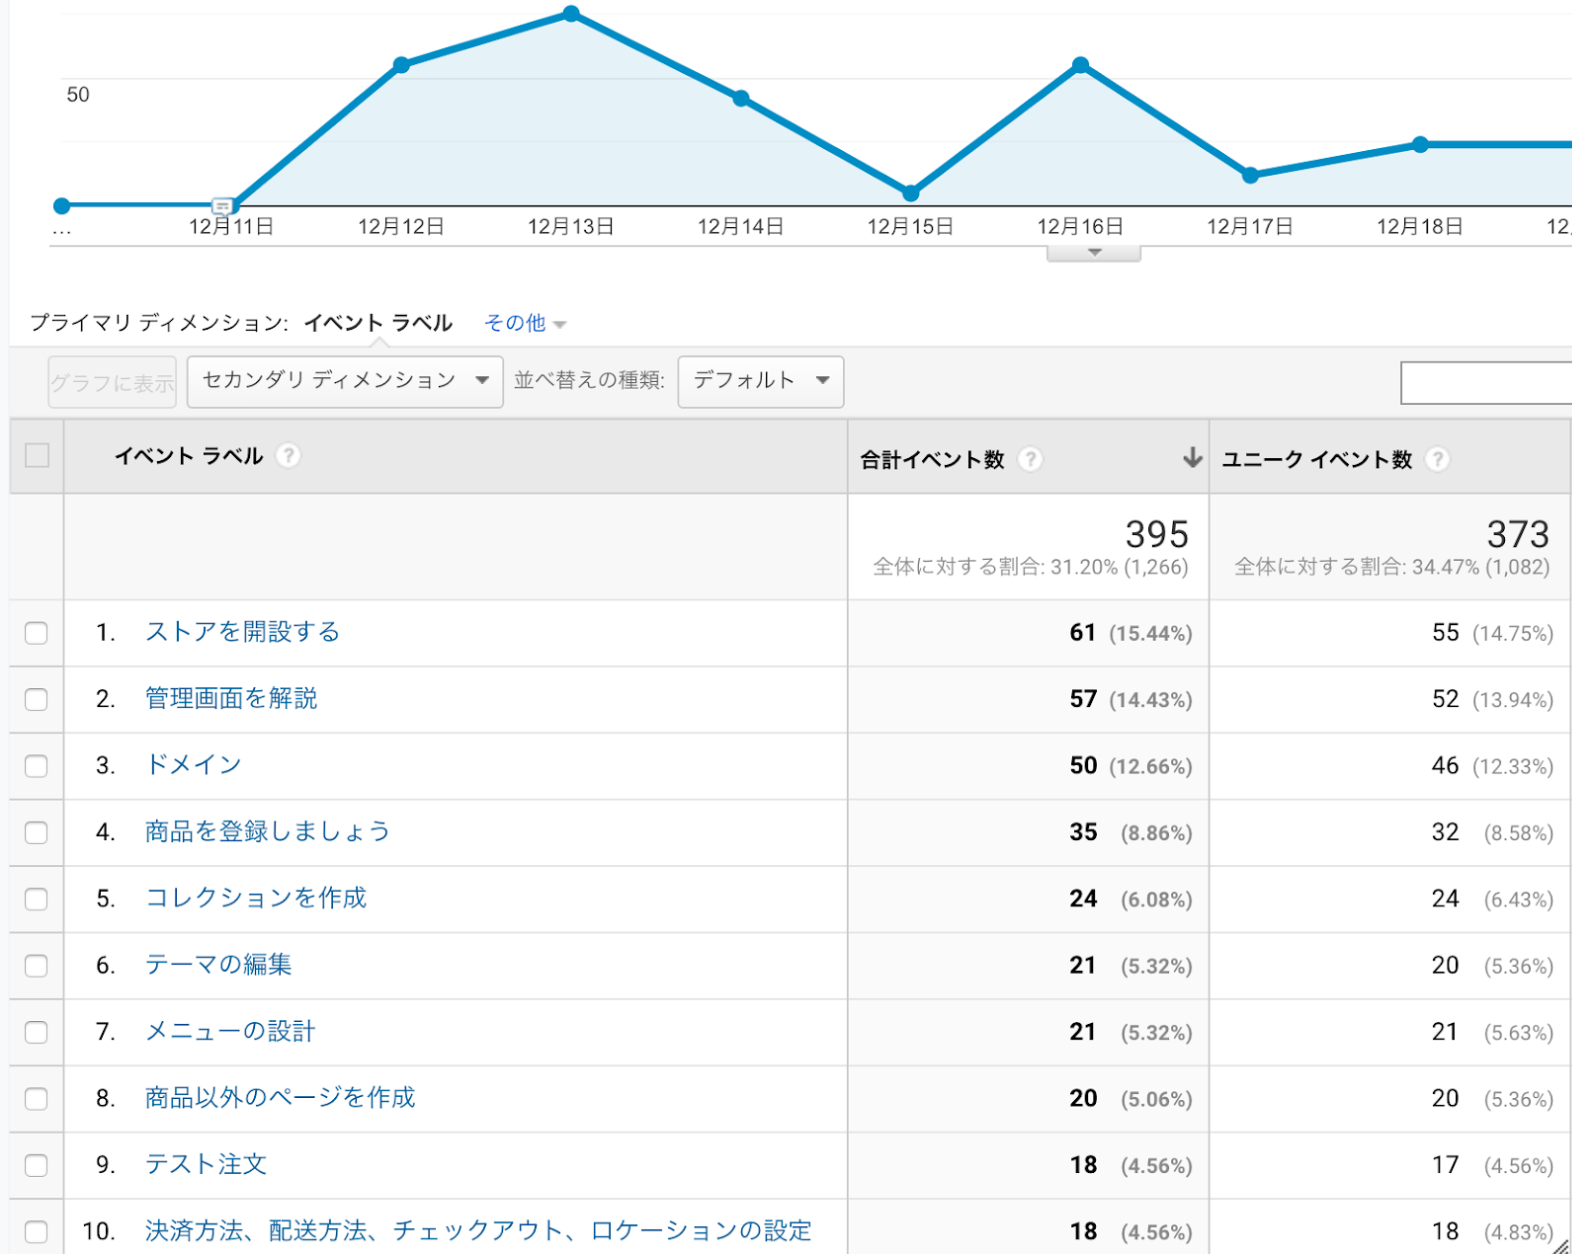
Take a look at Google Analytics “Behavior”> “Events”> “Top Events.” The event category name (Scroll Depth in the example) set in Google Tag Manager is displayed.
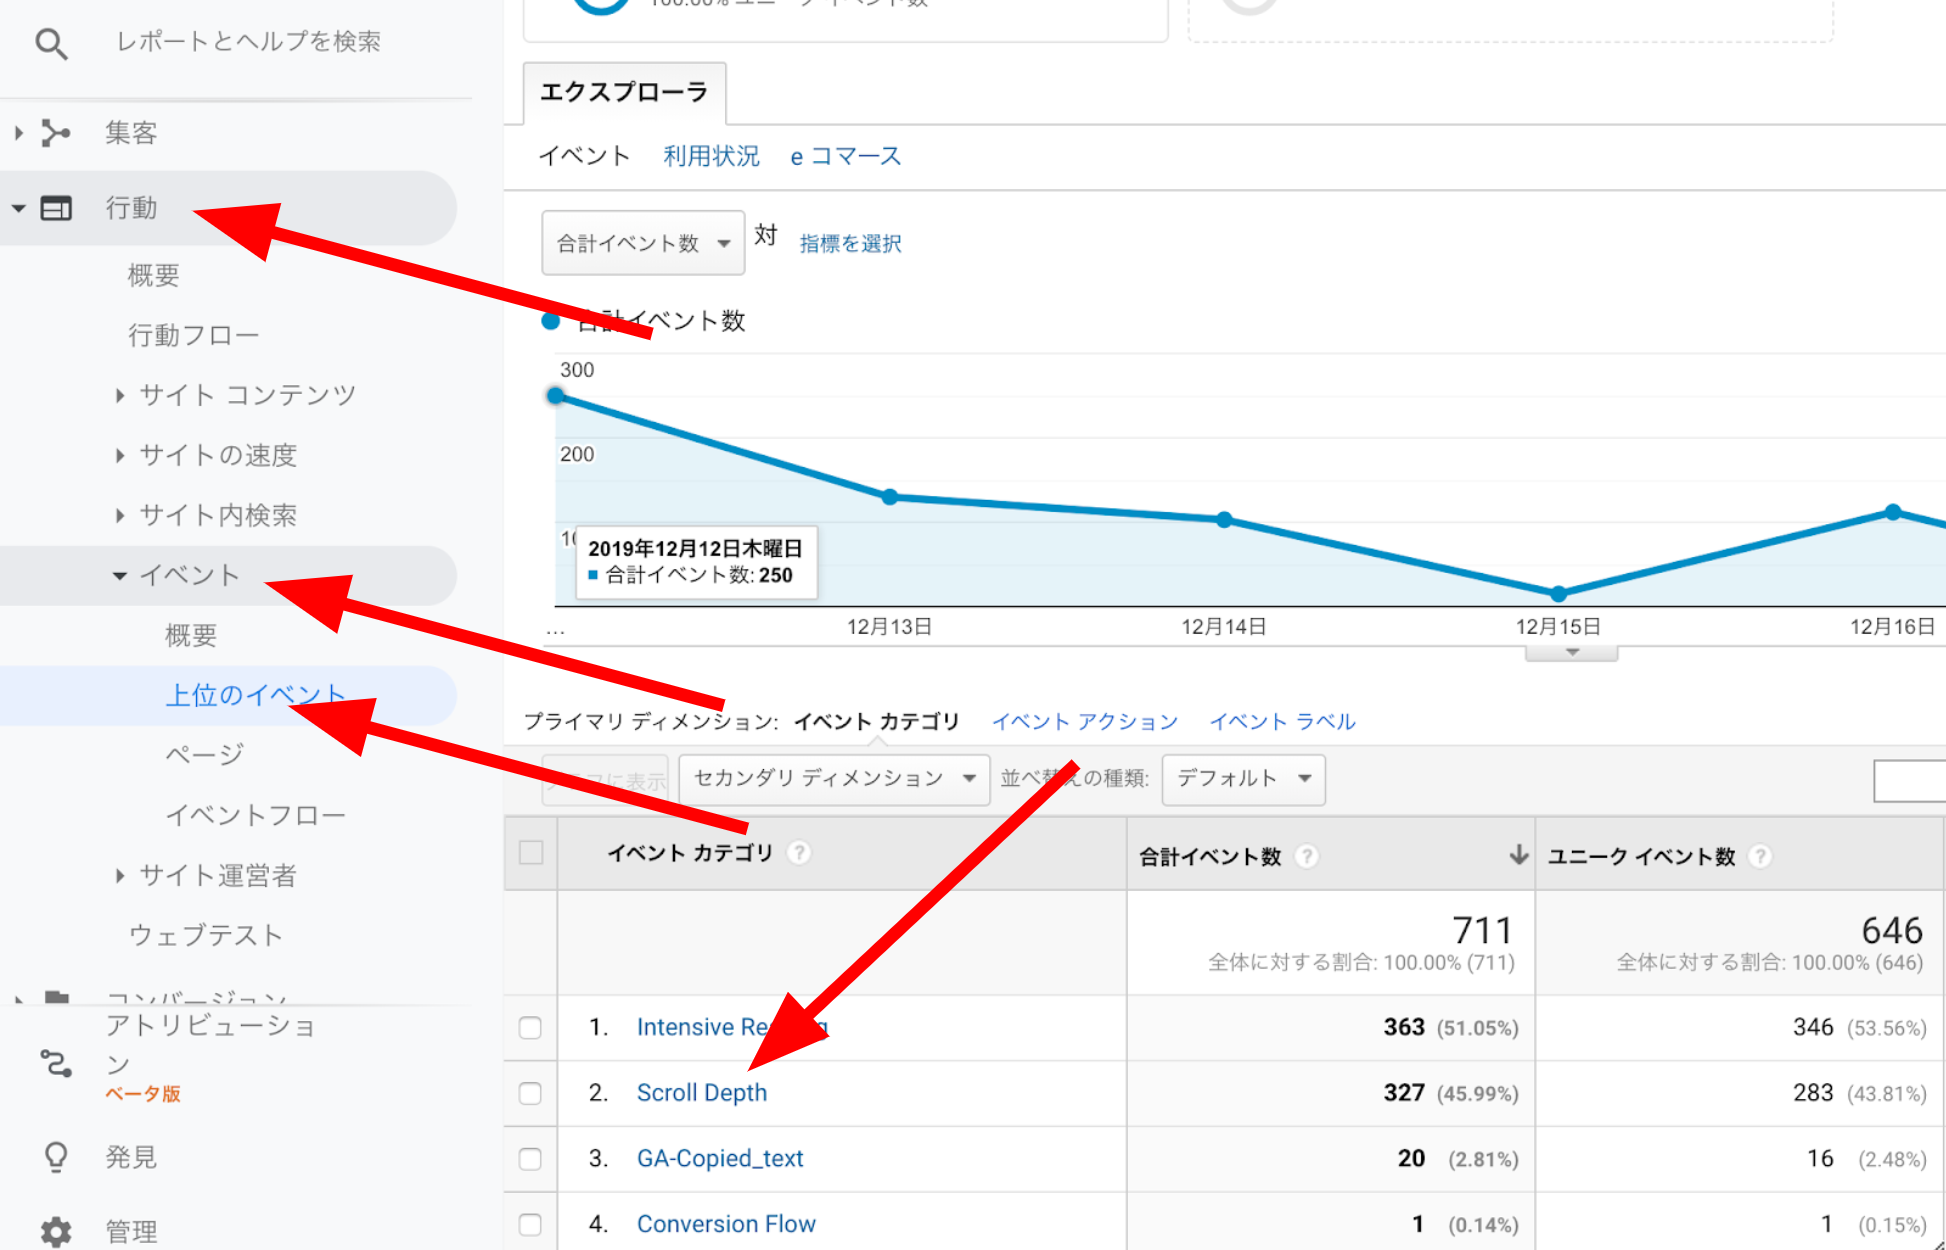
Click the event category name. The measurement target page will display. Click the page you want to analyze.
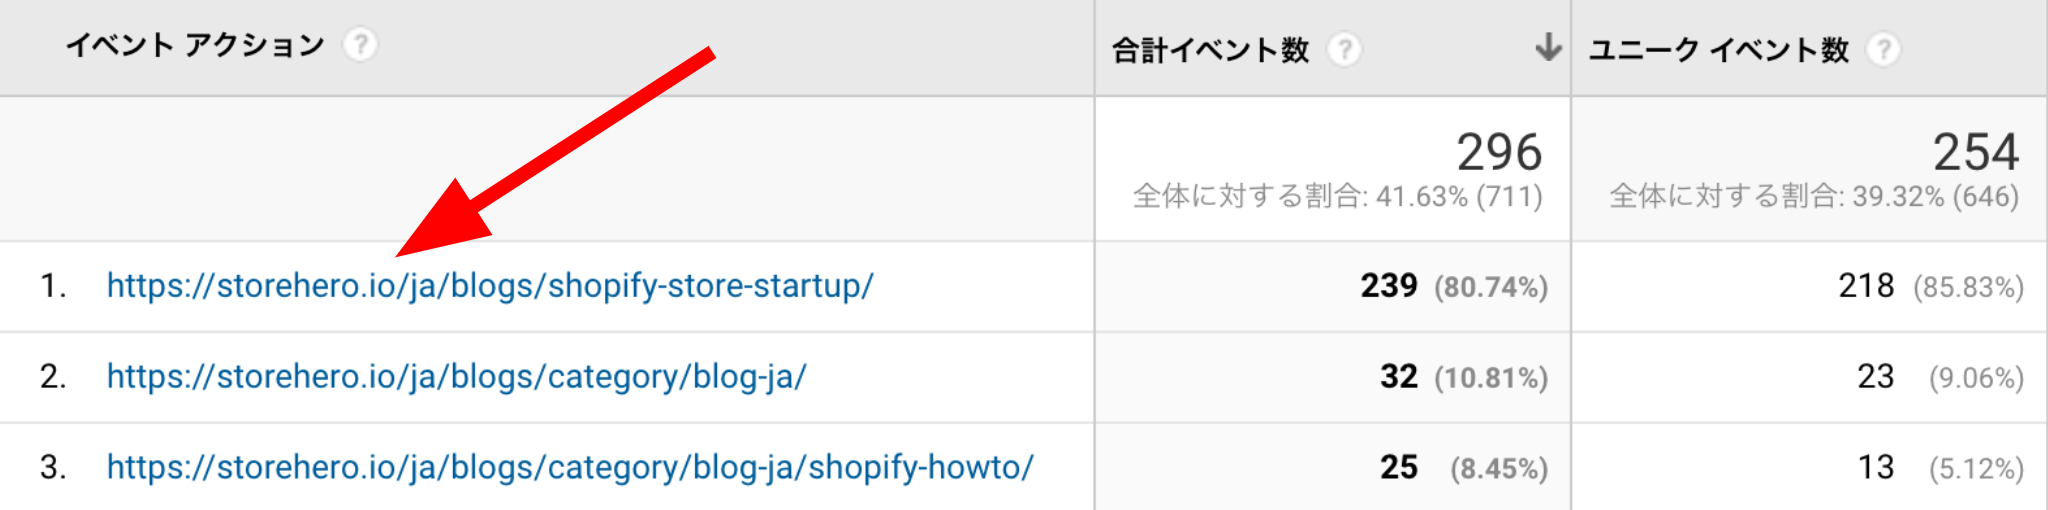
Then you can see how many times and what percentage the customer has scrolled for the target page.
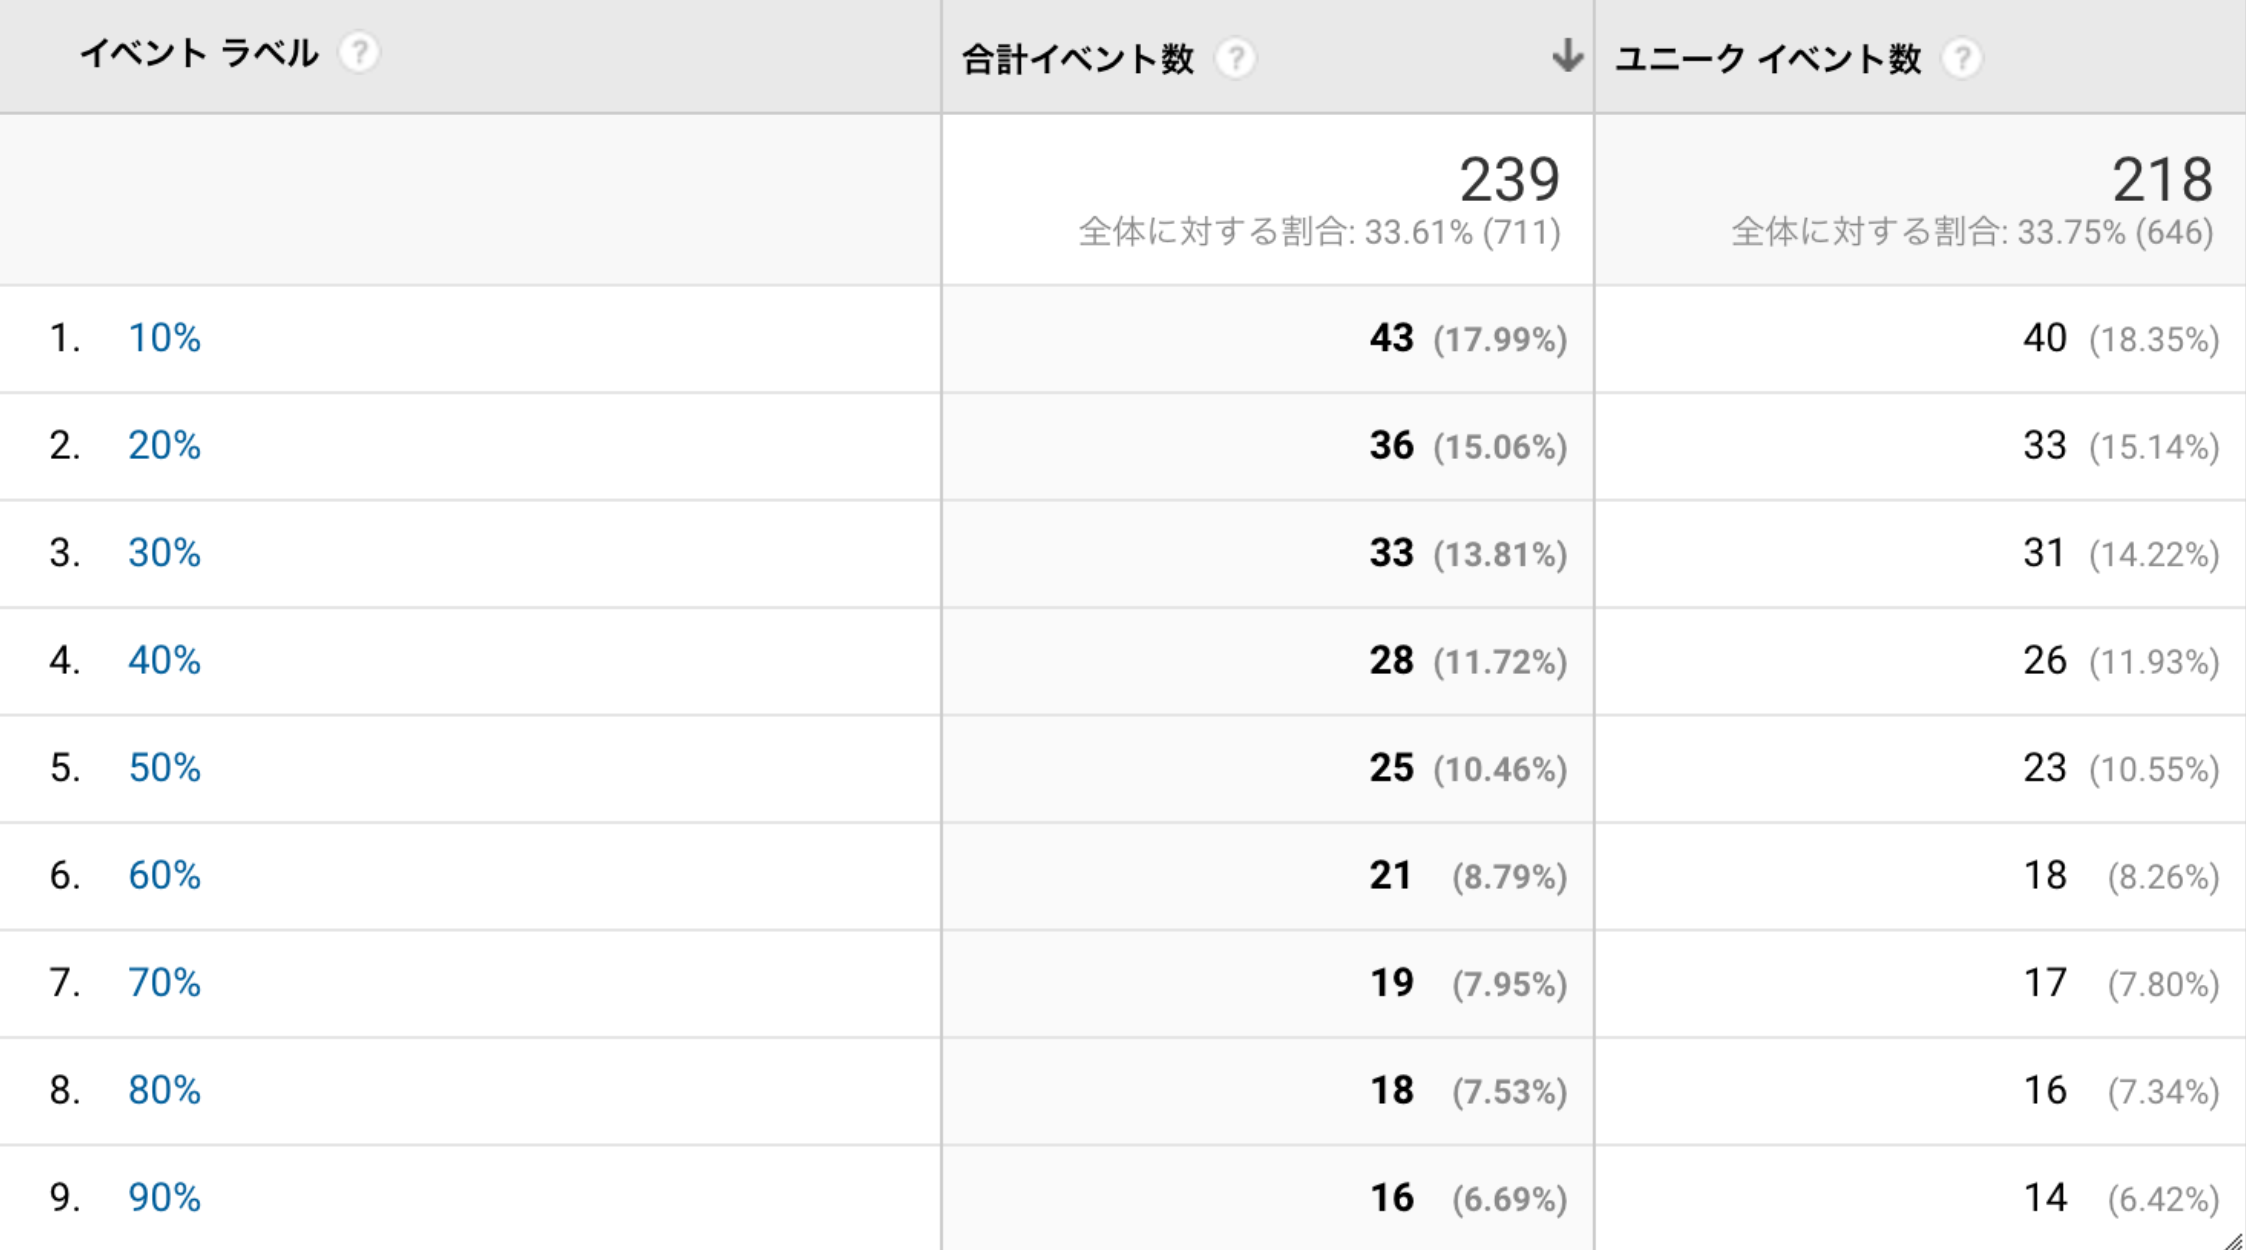
In the case of the example, about 18% of people read less than 10%. According to the result, you can realize there may be a problem with the first catch.
You can see which articles do visitors appropriately read by calculating the average value of multiple posts.
What blog content do visitors like better
Earlier, I analyzed what percentage of a blog that visitors read. But even if you know how much they read, it is sometimes difficult to understand which specific content in a blog caused abandonment.
With a little effort, you can easily find out which content visitors read in a blog.
This time, I will introduce a method to measure which subheading h2 tags of a blog was read.
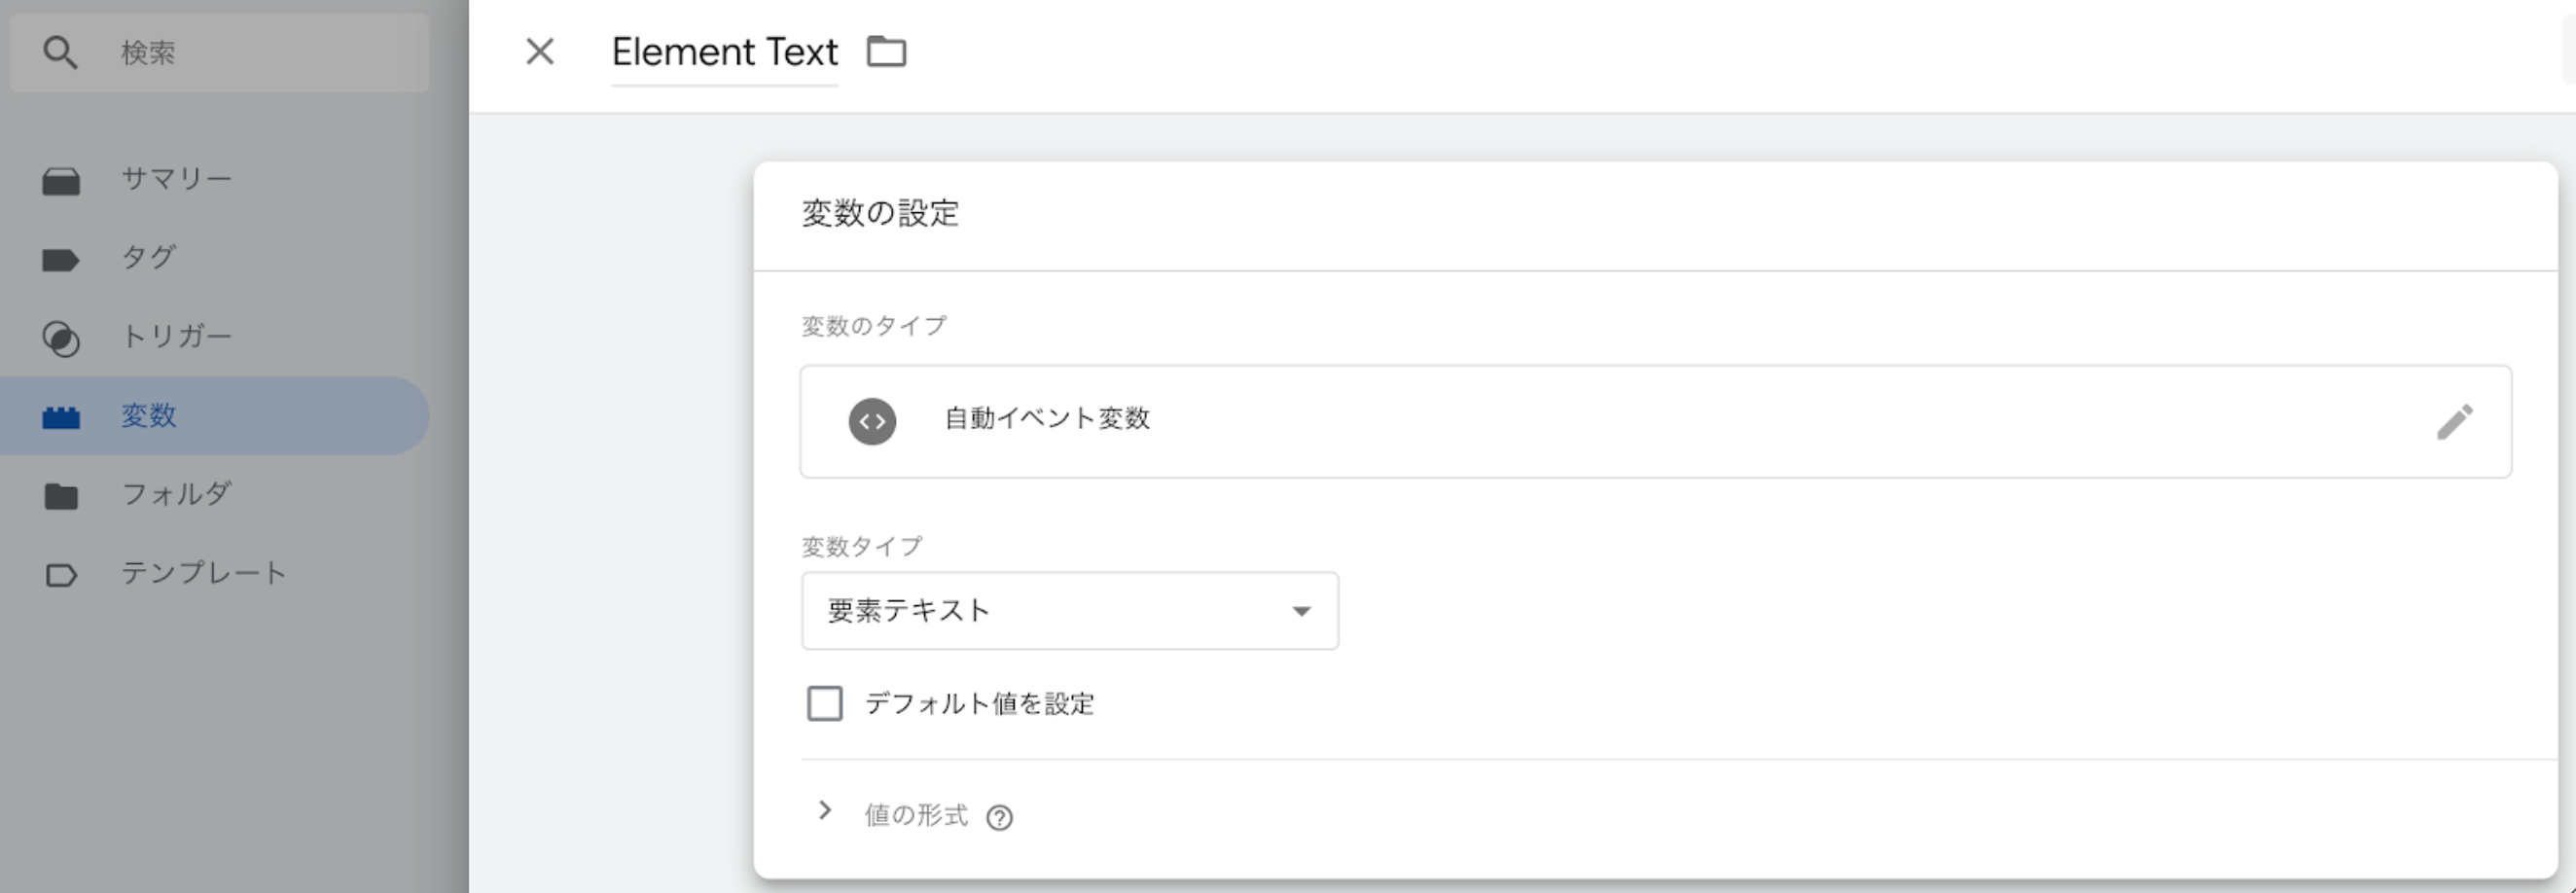
Create a variable to store the text in h2 tags in Google Tag Manager.
Create a new variable in “Variable”> “User-defined variable.” Save the variable type as “Automatic event variable” and the variable type as “Element text.”
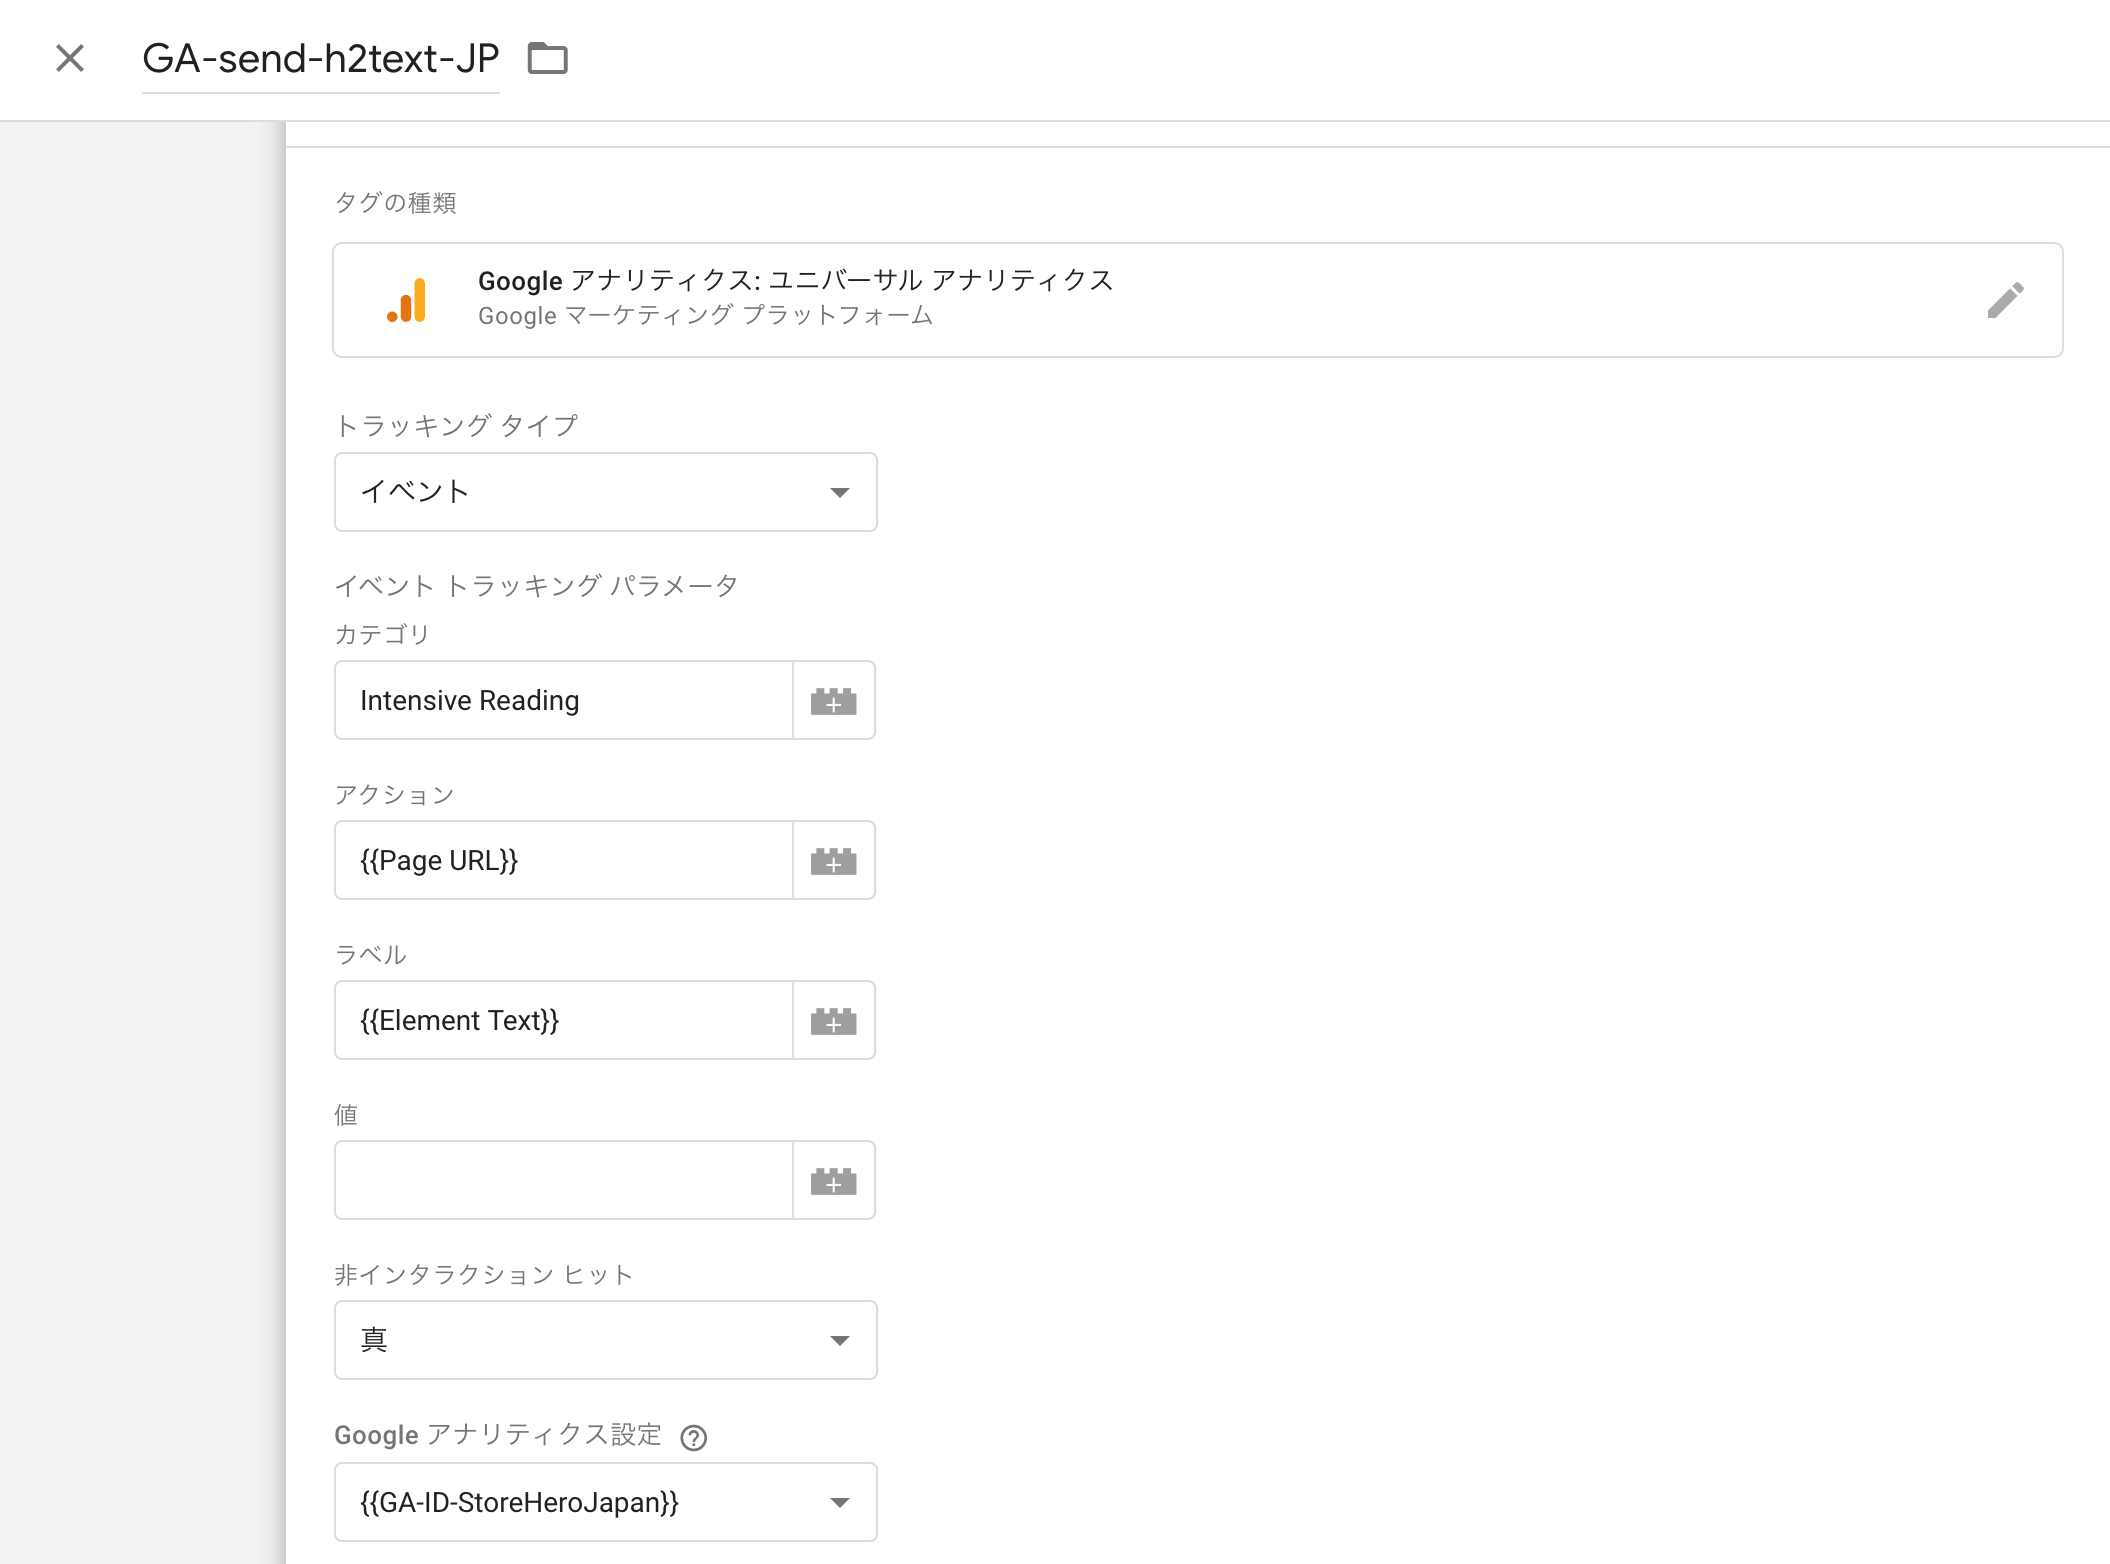
Set up Tags
Next, set the tags that will send the text inside h2 tags to Google Analytics when readers scroll through a blog article and see each h2 tag.
Create a new tag in the “Tags” menu and set as follows;
Tag Type: Google Analytics
Tracking Type: Event
Category: Give it any descriptive name.
Action: {{Page URL}}
Label: {{Element Text}} *Variable name created earlier
Non-interaction hit: True
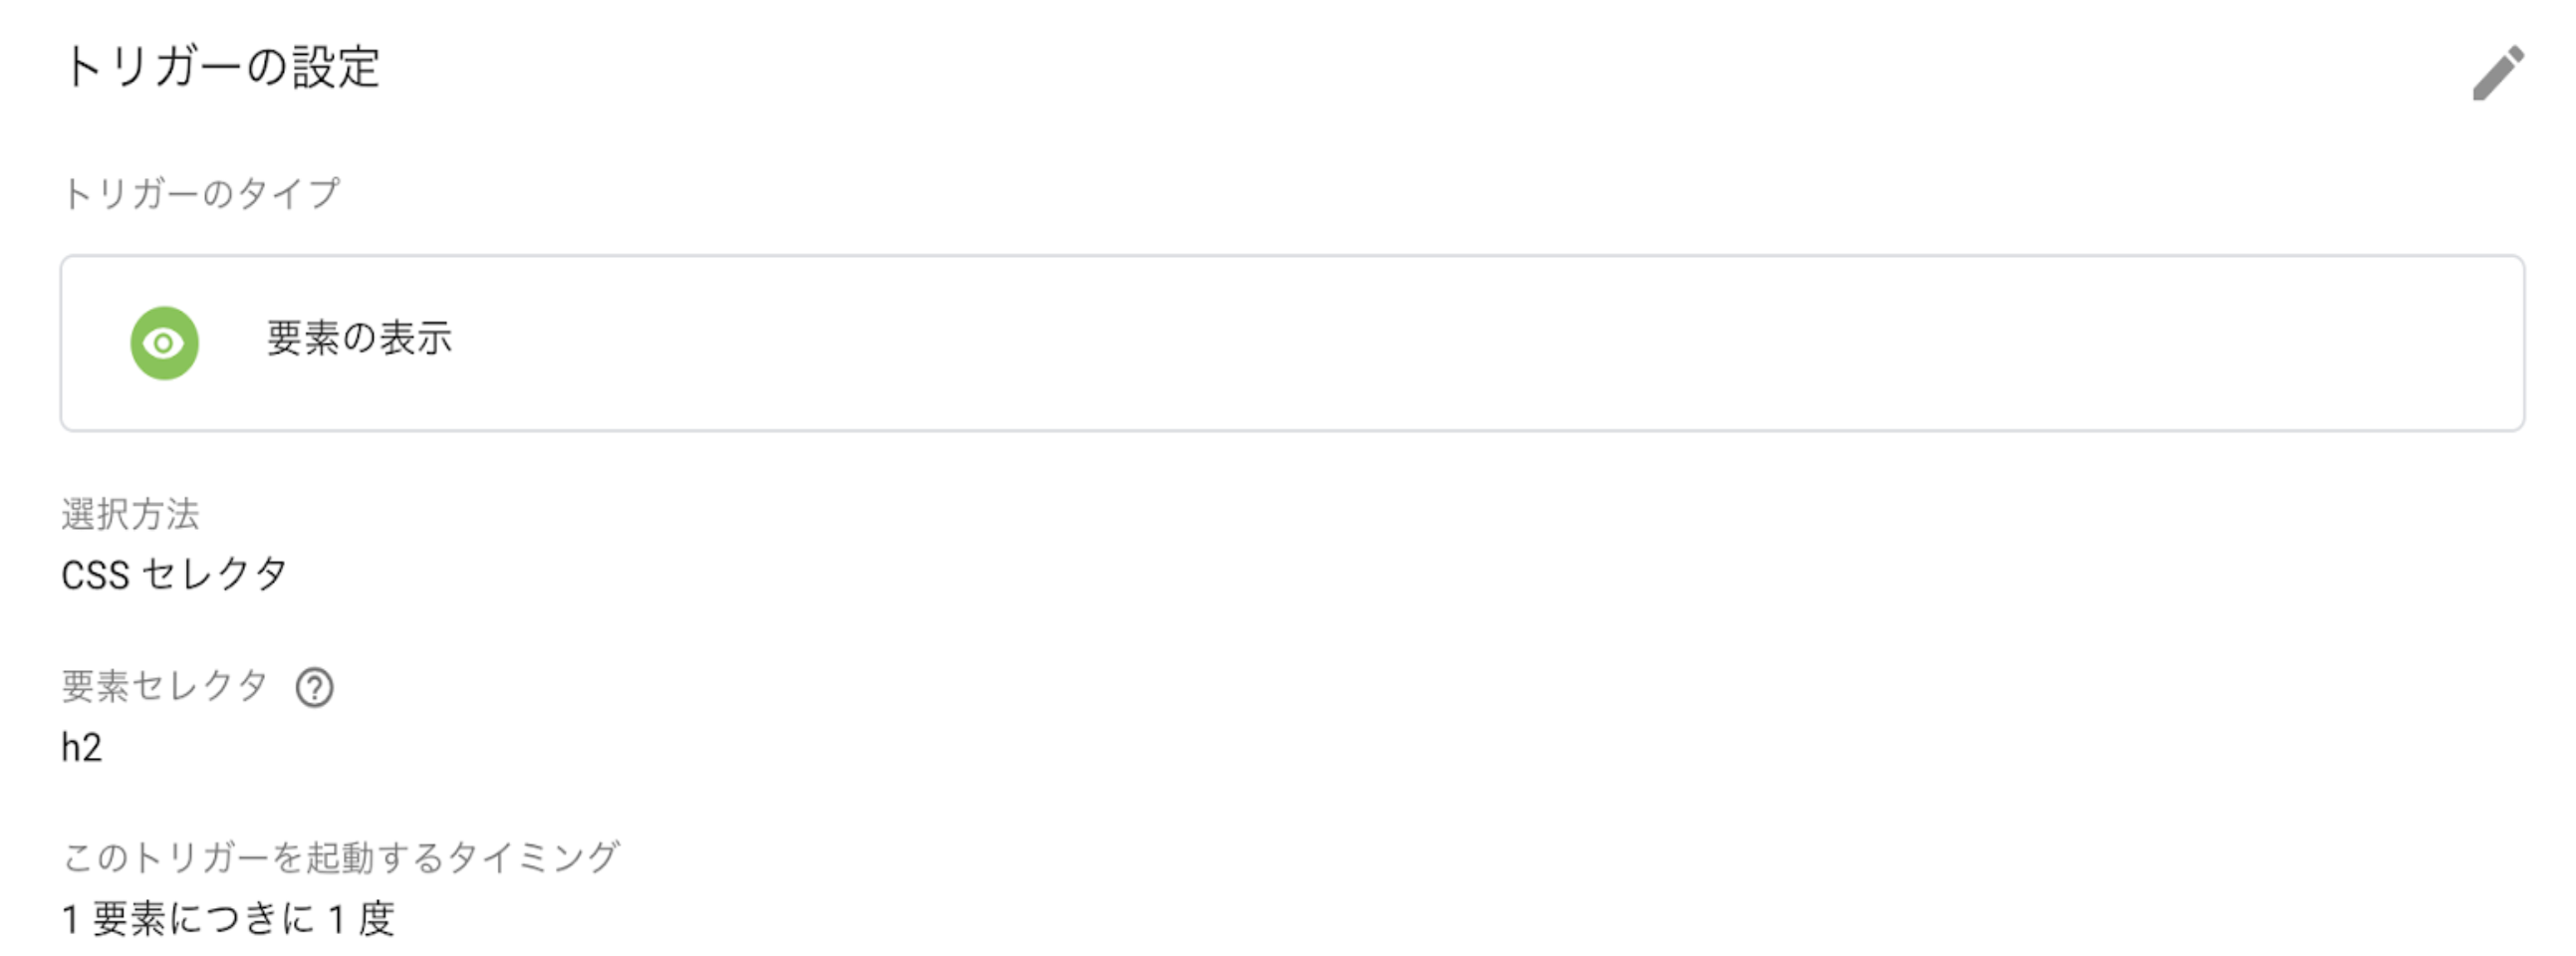
Set up Triggers
Create a trigger to fire this tag. Set as follows;
Trigger type: Element Visibility
Selection method: CSS selector
Element selector: h2
Timing of activating this trigger: Once per element
The tag you created earlier will fire when readers scroll through a blog, and h2 tags are displayed only with this setting.
Previously, you needed to write JavaScript to do the same setting. It is now possible to implement with the standard function of Google Tag Manager. Very convenient.
The settings on the Google Tag Manager have been completed. Save and publish it.
Analyze with Google Analytics
Let’s check how far a blog visitor reads with Google Analytics.
In Google Analytics, go to “Actions”> “Events”> “Top Events,” click the event category name you created this time, and then click the event action name (target URL in this example).
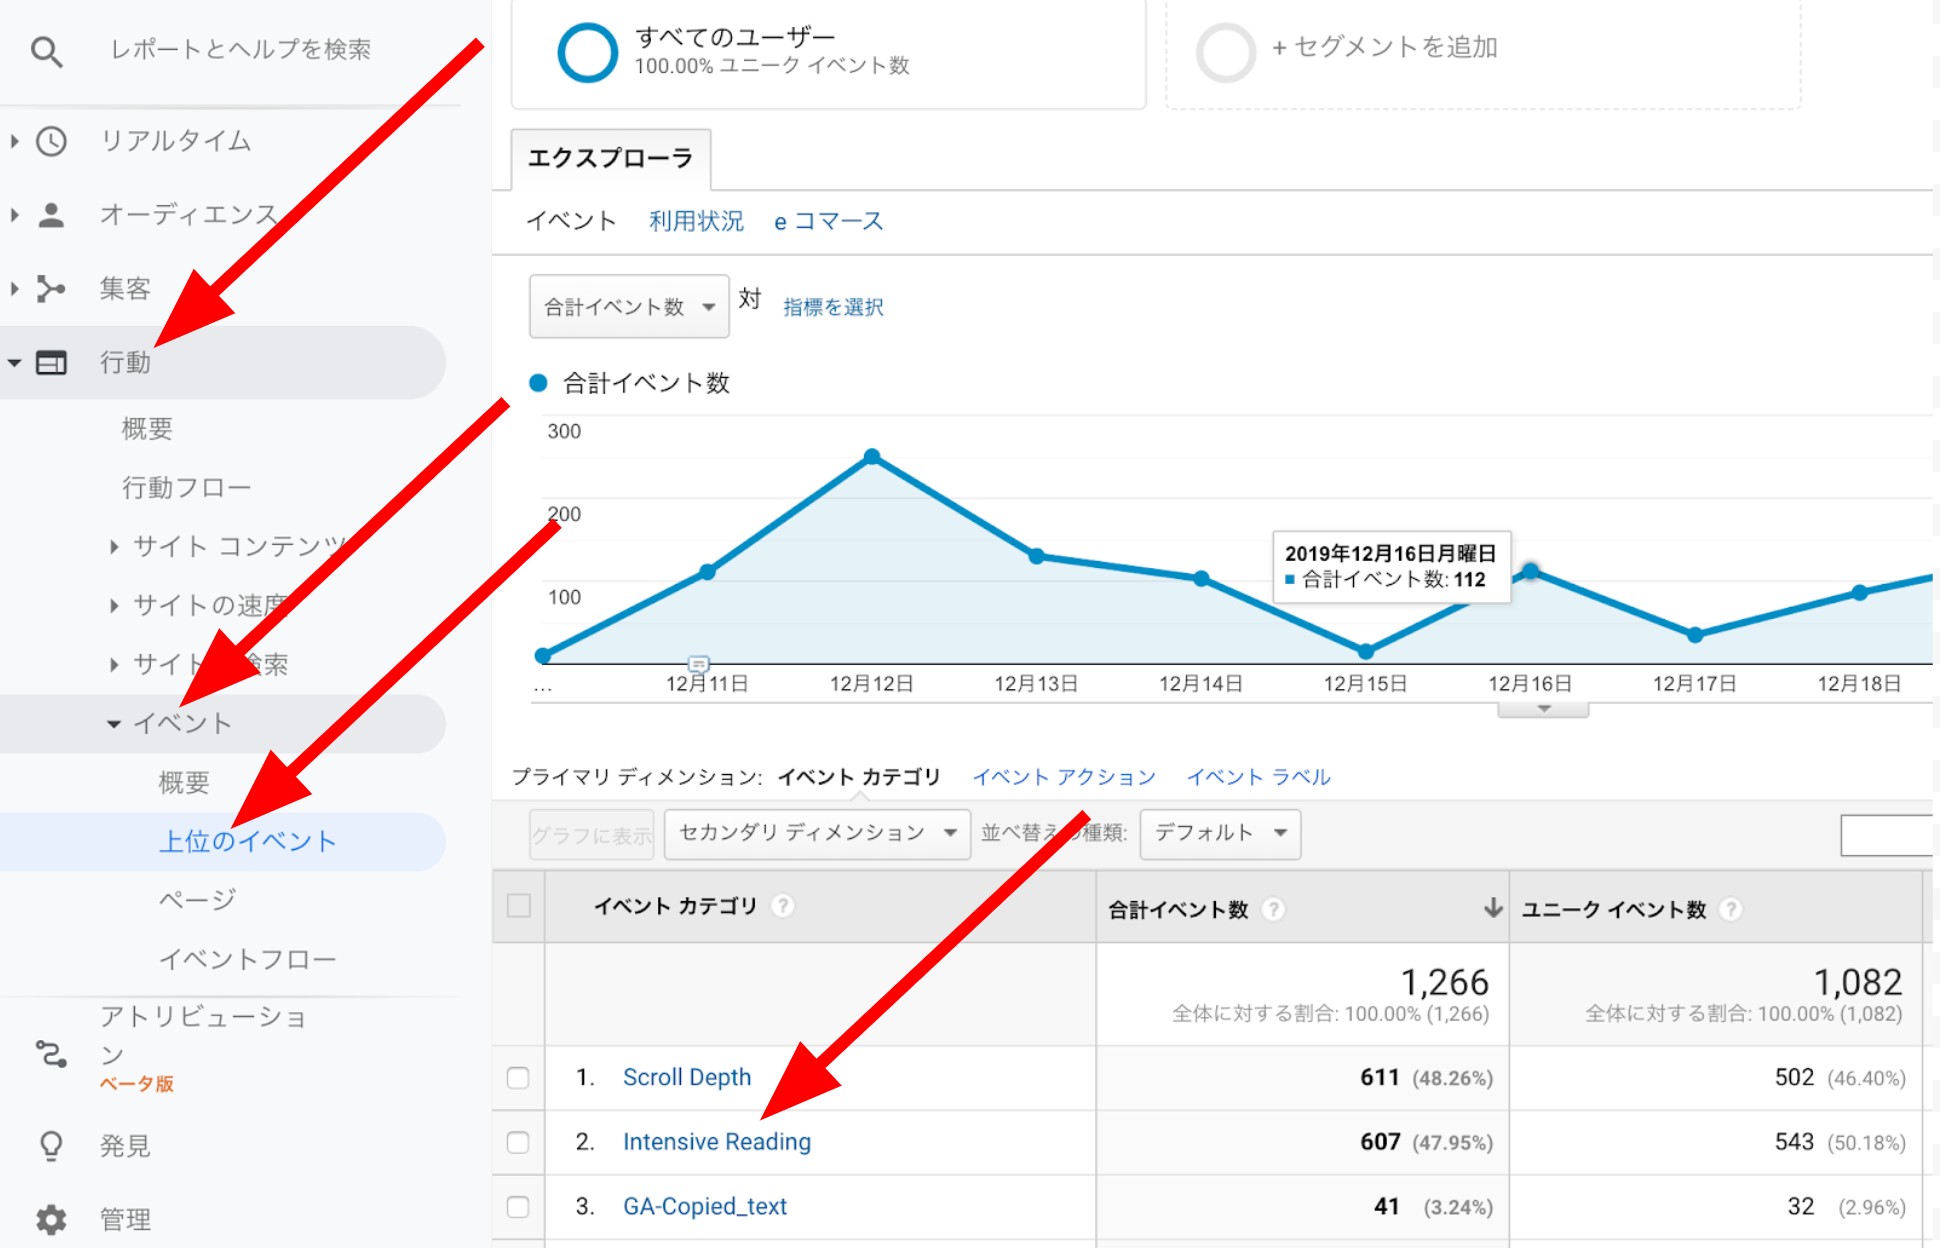
You will see the aggregated total number of how far the target page’s heading (h2) visitors read. It shows clearly which part of a blog caused the abandonment.
To layout, a concrete strategy, knowing which content causes the abandonment is the key.
Summary
I have introduced the methods of analyzing “what percentage of a blog visitors read” and “which blog content visitors read” in Shopify.
Once you establish the Shopify store and run Owned Media using Shopify’s blog, make sure that the blog article you created reaches your customers adequately.
Measure not only the number of customers (the number of sessions and UU-Unique User) but also the level of engagement.
There are other aspects of KPI (Key Performance Indicator) for engagement and the readability of the articles introduced this time. Try using indexes that match your strategy and tactics, such as the number of repeats, the registered email newsletters, and the followers.
Please write in the comment field if you have any requests for new article topics on how to grow your Shopify.
* In the tag settings of Google Tag Manager, mistakenly posted a screenshot with “Non-interaction hit” selected “fake.” I fixed it to be “true.”
GrowthHack consulting services specialize in Shopify
StoreHero provides the Commerce Hack and a growth hack consulting service specialized in Shopify.
It supports Shopify owners to grow faster, get their businesses back on track, and run their businesses.
If you want to use Shopify to grow your commerce business, please do not hesitate to contact us.